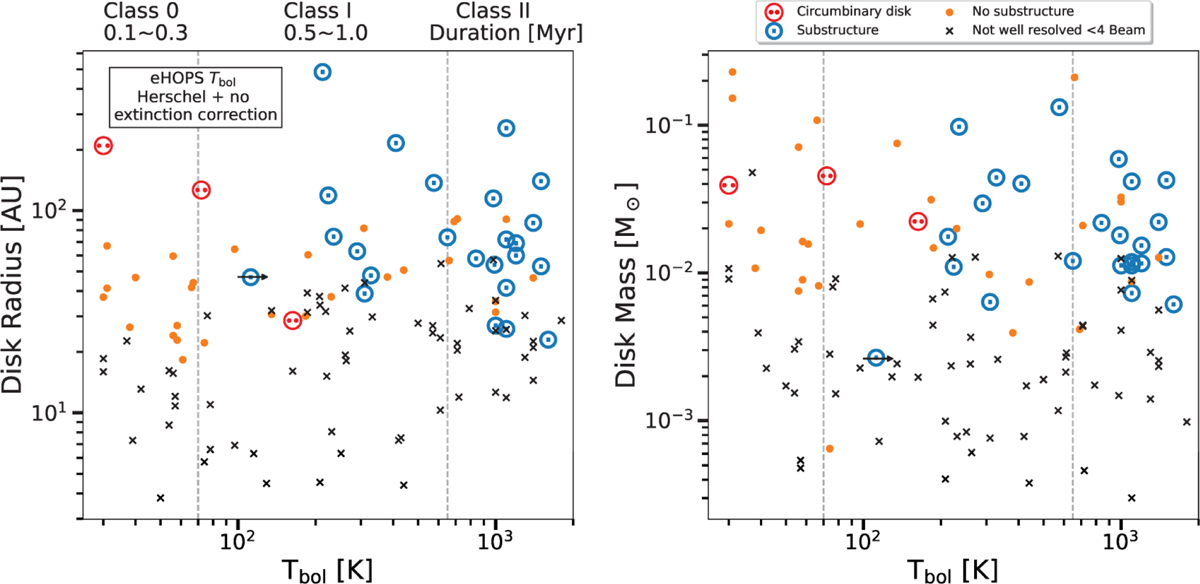
Fig. 1
Download original image
Protostellar disk substructure detections as a function of disk radius, mass, and bolometric temperature. The latter was taken from the eHOPS catalog. The dashed gray lines indicate the approximate boundary between the Class 0 and Class I evolutionary phases, and between the Class I and Class II ones (Chen et al. 1995), along with the corresponding expected duration of each Class (Dunham et al. 2015). While the Tbol is not linear with age, in general the Class 0 sources have Tbol < 70 K, Class I sources have 70 < Tbol < 650 K, and Class II and Class III sources have Tbol > 650 K (Bouvier et al. 2021). The black arrow is used to indicate that the particular source has also been classified as Class II in the literature (Narayanan et al. 2023).
Current usage metrics show cumulative count of Article Views (full-text article views including HTML views, PDF and ePub downloads, according to the available data) and Abstracts Views on Vision4Press platform.
Data correspond to usage on the plateform after 2015. The current usage metrics is available 48-96 hours after online publication and is updated daily on week days.
Initial download of the metrics may take a while.