| Issue |
A&A
Volume 700, August 2025
|
|
|---|---|---|
| Article Number | A235 | |
| Number of page(s) | 14 | |
| Section | Interstellar and circumstellar matter | |
| DOI | https://doi.org/10.1051/0004-6361/202555174 | |
| Published online | 22 August 2025 | |
CAMPOS
II. The onset of protostellar disk substructures and planet formation
1
Department of Astronomy, Yale University,
New Haven,
CT
06511,
USA
2
Department of Astronomy, The University of Texas at Austin,
2515 Speedway, Stop C1400,
Austin,
TX
78712-1205,
USA
3
Max Planck Institute for Extraterrestrial Physics,
Gießenbachstraße 1,
85748
Garching bei München,
Germany
4
Departamento de Astronomía, Universidad de Chile,
Camino El Observatorio 1515,
Las Condes,
Chile
5
Department of Physics, Middlebury College,
Middlebury,
VT
05753,
USA
6
Los Alamos National Laboratory,
Santa Fe,
NM
87545,
USA
7
National Science Foundation-Simons AI Institute for Cosmic Origins, The University of Texas at Austin,
2515 Speedway, Stop C1400,
Austin,
TX
78712-1205,
USA
★ Corresponding author: This email address is being protected from spambots. You need JavaScript enabled to view it.
Received:
15
April
2025
Accepted:
24
June
2025
Abstract
The 1.3 mm CAMPOS survey has resolved 90 protostellar disks with ~15 au resolution across the Ophiuchus, Corona Australis, and Chamaeleon star-forming regions. To address the fundamental question of when planet formation begins, we combined the CAMPOS sample with literature observations of Class 0-II disks (bolometric temperature, Tbol ≤ 1900 K), all mapped at 1.3 mm with resolutions ranging from 4 to 33 au. To investigate substructure detection rates as a function of bolometric temperature, we restricted the sample to disks observed at a wavelength of 1.3 mm, with inclinations below 75° and linear resolutions ≤20 au, and resolved with at least four resolution elements (θdisk/θres ≥ 4). We also considered the effects of extinction correction and the inclusion of Herschel Space Telescope data on the bolometric temperature measurements to constrain the lower and upper limits of bolometric temperature for each source. We find that by Tbol ~ 200-400 K, substructure detection rates increase sharply to ~60%, corresponding to an approximate age of 0.2–0.4 Myr. No substructures are detected in Class 0 disks. The ratio of disk-averaged brightness temperature to predicted dust temperature shows a trend of increasing values toward the youngest Class 0 disks, suggesting higher optical depths in these early stages. Our statistical analysis confirms that substructures similar to the ones in Class II disks are already common by the Class I stage, and the emergence of these structures at Tbol ~ 200-400 K could represent only an upper limit. Classifying disks with substructures into those with and without large central cavities, we find both populations coexisting across evolutionary stages, suggesting that they are not necessarily evolutionarily linked. Suppose protostellar disk substructures do follow an evolutionary sequence. In that case, our results imply that disk substructures evolve very rapidly and thus can be present in all Class I/II stages and/or that they can be triggered at different times.
Key words: methods: observational / techniques: interferometric / planet-disk interactions / stars: low-mass
The NASA Hubble Fellowship Program Sagan Fellow.
© The Authors 2025
 Open Access article, published by EDP Sciences, under the terms of the Creative Commons Attribution License (https://creativecommons.org/licenses/by/4.0), which permits unrestricted use, distribution, and reproduction in any medium, provided the original work is properly cited.
This article is published in open access under the Subscribe to Open model. This email address is being protected from spambots. You need JavaScript enabled to view it. to support open access publication.
1 Introduction
One of the major challenges in the field of planet formation is understanding the relationship between circumstellar disk properties and the outcome of the planet formation process (Miotello et al. 2023). The advent of high-resolution observations by the Atacama Large Millimeter/Submillimeter Array (ALMA) has fundamentally transformed our understanding of planet formation, unveiling intricate substructures within Class II disks (age ≳1 Myr). These substructures manifest varied natures – some are potentially sculpted by preexisting planets, while others, such as dense rings, may act as nurseries for the formation of planetesimals and subsequent planet generations (ALMA Partnership 2015; Cieza et al. 2017; Pérez et al. 2019; Dong et al. 2017; Jin et al. 2016). The prevalence of substructures in Class II pro-toplanetary disks has raised questions about how early these substructures form, and thus when the planet formation process begins (Bae et al. 2023).
Previous searches for disk substructures in Class 0/I disks have been limited and focused on the brightest and largest disks (e.g., Sakai et al. 2019; Segura-Cox et al. 2020; Sheehan et al. 2020; Cieza et al. 2021; Ohashi et al. 2023; Lee et al. 2023). Our recent ALMA CAMPOS program has uniformly surveyed 18 Class 0, 31 Class I, 22 flat-spectrum, and 19 early Class II pro-tostellar disks with a resolution of 15 au in nearby star-forming regions within 200 pc (Hsieh et al. 2024). Together with existing literature data, forming a total sample of 116 disks, we conducted a statistical study of the onset of disk substructures in embedded protostellar disks with a large sample and in different environments.
This paper is organized as follows. In Sections 2 and 3, we describe the substructure identification, mass calculation using the disk fluxes, and the construction of a homogeneous sample to search for the onset of disk substructures. We restricted the disk sample observed at the same 1.3 mm wavelength, with an inclination angle below 75° and resolved with at least four beams. In Section 4, we present the main result of this paper: the substructure detection rate statistics as a function of evolutionary stage tracked by bolometric temperature. In addition, we discuss the existence of 2 populations of disk substructures. We discuss our results in Section 5, and present our conclusion in Section 6.
2 Data
2.1 Observational data and the sample construction
The detailed data reduction and the survey design for the CAMPOS survey are described in Hsieh et al. (2024). We combined the CAMPOS uniform survey of 90 protostellar disks at ~14-18 au in Corona Australis, Chamaeleon I & II, Ophiuchus North, and Ophiuchus (Hsieh et al. 2024) with protostellar disks from the high-resolution (~7 au) eDisk survey (Ohashi et al. 2023), medium-resolution (~28 au) ODISEA survey (Cieza et al. 2019), high-resolution (~4 au) ODISEA survey (Cieza et al. 2021), and high-resolution (~4 au) DSHARP survey (Andrews et al. 2018a) to study the onset of disk substructures. We also included high-resolution (~4 au) observations of HL Tau (ALMA Partnership 2015).
When constructing a homogeneous sample to search for protostellar disk substructures, it is crucial to consider various observational biases. Detecting protostellar disk substructures requires spatially resolved disks. Previous studies of more evolved protoplanetary disks have shown that the detection rate of protoplanetary substructures strongly depends on the effective angular resolution (θD/θres), where θD is the diameter of the disk containing 90% of the continuum emission and θres is the angular resolution of the observation. Bae et al. (2023) showed that if the effective angular resolution is below 3, substructures are detected in only 2% of 256 protoplanetary disks. In contrast, substructures are detected in 52% of the protoplanetary disks with an intermediate effective angular resolution (3 ≤ θD/θres ≤ 10), and 95% of the protoplanetary disks for (θD/θres ≥ 10). To take into account this resolution bias and have a comparable criteria for the different sets of observations, we only analyzed sources With θD/θres ≥ 41.
In relation to the resolution, we note that the absolute linear resolution naturally determines the smallest substructure scales that can be probed. The smallest detectable substructure scale is around half the beam size (Martí-Vidal et al. 2012). We would use this to discuss the statistics of the size of substructures in the sample.
Besides the effective angular resolution and linear resolution, it is also important to compare observations at the same wavelength. The thermal and scattered continuum emission at a wavelength, λ, is dominated by grains with a size of ~λ/2π (Mie 1908), meaning ALMA 1.3 mm observations, such as the CAMPOS survey as well as DSHARP and eDISK, are more efficient at probing a few 100 µm-sized grains. In contrast, disk observations in the optical/near-infrared mainly probe much smaller sub-micrometer particles. To ensure a consistent survey probing the substructures from similar solids, we only included protostellar disks observed at 1.3 mm wavelength by ALMA. Finally, the occurrence rate of substructures is also influenced by the disk’s inclination angle. Due to the increasing optical depth and reduced emitting size, searching for disk substructures in edge-on disks is extremely challenging. While most of the high-resolution observations toward the more evolved Class II disks have avoided highly inclined sources (e.g., DSHARP), the population of Class 0/I disks in nearby regions is more limited, and thus samples of very high-resolution observations (e.g., eDisk) contain a significant number of highly inclined disks. To take this into account, we excluded all disks in the sample with inclination angles larger than 75°2.
2.2 Substructure criteria
In this paper, we have labeled disks with substructures if the disk has rings, gaps, a central cavity, or spirals. Sources with asymmetric intensity profiles but lacking annular or spiral structures (e.g., IRAS 16293-2422B, Zamponi et al. 2021, 2024; Hsieh et al. 2024) are counted as disks without substructures.
We note that following the above criteria, all of the disks considered to have substructures in this work have already been confirmed as such in separate published papers (CAMPOS: Hsieh et al. (2024), eDisk: Ohashi et al. (2023), ODISEA: Cieza et al. (2019, 2021), DSHARP: Andrews et al. (2018a), and all correspond to substructures that are immediately visible in the 1.3 mm image. Sources that show small variations as a function of distance in uv-space or small variations in the intensity radial profile but appear smooth in the image plane are counted here as disks without substructures (e.g., Michel et al. 2023). This is a conservative approach, and we may miss some sources with borderline detections, introducing a bias against younger disks with smaller and lower-contrast (shallower) substructures (e.g., Maureira et al. 2024). The implications of this will be further discussed in Section 5.
3 Analysis
3.1 Disk fluxes and sizes
In CAMPOS I, we presented a study on the evolution of proto-stellar disk radii (Hsieh et al. 2024). Both disk sizes and fluxes were derived from a 2D Gaussian fit with the CASA imfit task (McMullin et al. 2007). Disk sizes were calculated as the 2σ size of the deconvolved major axis, which corresponds to approximately the radius containing 90% of the flux, R90. For sources that exhibit emission profiles that deviate significantly from a Gaussian shape, due to disk substructures, or that have poor CASA imfit results, due to low S/N, we used the 5σ contour in the Briggs 0.5 weighted maps to measure the radius and flux (Hsieh et al. 2024)3. We present the CAMPOS flux measurements in Table A.1. Note that if a CAMPOS source was also observed at the same frequency (ALMA Band 6) but with a higher angular resolution by other surveys, we report the proto-stellar disk flux and size from the literature instead. This ensures that for each disk presented in Table A.1, the disk flux and radius are measured using the highest-angular-resolution ALMA data available.
3.2 Deriving the mass of protostellar disks
We adopted the method outlined in the ODISEA survey of Ophiuchus protoplanetary disks to convert the 1.3 mm disk flux into dust mass. This method assumes optically thin emission, a constant temperature of 20 K, and an opacity coefficient of κν = (ν/100GHz)cm2g−1 (Williams et al. 2019). We then assumed a gas-to-dust ratio of 100 to obtain the disk mass (Bae et al. 2023). We caution that disks might not be fully optically thin, particularly at the early stages (e.g., Li et al. 2017; Zamponi et al. 2021; Lin et al. 2021; Maureira et al. 2022), but also at the Class II stage (Andrews et al. 2018b; Tazzari et al. 2021; Chung et al. 2024). In this case, the estimated masses can be conservatively considered a lower limit. The protostellar disk mass measurement is for better comparison with other works and as a guide, and it does not affect the analysis of the onset of disk substructures.
3.3 Bolometric temperature as a disk evolutionary tracer
We cross-matched all protostellar disks with the Young Stellar Objects catalog from the Spitzer Space Telescope “cores to disks” (c2d) and “Gould Belt” (GB) Legacy surveys (Dunham et al. 2015), as well as the Extension of HOPS Out to 500 ParSecs (eHOPS) catalog (Riwaj Pokhrel, private communication), to obtain the bolometric temperature (Tbol), which serves as a proxy for relative evolutionary age for embedded protostellar systems (see Appendix B). The eHOPS catalog contains 1–850 µm spectral energy distributions (SEDs) assembled from Two Micron All Sky Survey (2MASS), Spitzer, Herschel Space Telescope (Herschel), Wide-field Infrared Survey Explorer (WISE), and James Clerk Maxwell Telescope (JCMT)/SCUBA-2 data. The first eHOPS paper for the Serpens and Aquila molecular clouds was published by Pokhrel et al. (2023). For all other clouds, the SED and protostellar system properties are available in the NASA/IPAC Infrared Science Archive4. For sources without a counterpart in both eHOPS and Dunham et al. (2015), we adopted the Tbol from the literature. Given that we want to investigate the emergence of substructures, we only included samples with Tbol ≤ 1900 K. The final list of sources with Tbol ≤ 1900 K and an inclination angle of less than 75° is shown in Table A.1. In Table A.2, we present the alternative names for each source in the CAMPOS survey for the Corona Australis, Chamaeleon I & II, Ophiuchus North, and Ophiuchus sources. The cross-matched results for the ODISEA survey are presented in Table A.3.
In this paper, we consider the bolometric temperature measurements from both the eHOPS catalog and the Dunham et al. (2015) catalog to trace the onset of protostellar disk evolution. Compared to Dunham et al. (2015), the eHOPS catalog provides more complete SEDs from 1 to 850 µm. However, the infrared portion of the SED is not corrected for extinction (Pokhrel et al. 2023). To maintain consistency with the eHOPS catalog, we used the bolometric temperatures without extinction correction from Dunham et al. (2015) for sources without a counterpart in eHOPS. The extinction correction applied to the infrared data increases the infrared flux and thus further increases the bolometric temperature (Dunham et al. 2015). Results based on this correction represent the upper age limit for the onset of disk substructures as longer-wavelength Herschel data are not included from the SED fitting to compute Tbol. Therefore, results based on the eHOPS bolometric temperatures represent a lower age limit for the onset of disk substructures. On the other hand, to investigate the upper age limit for the onset of disk substructures, we adopted the extinction-corrected bolometric temperature from Dunham et al. (2015).
The bolometric temperature measured from the eHOPS catalog and Dunham et al. (2015) differs from source to source. The decrease in Tbol is not uniform when including Hershel data in Dunham et al. (2015). It depends both on the shape of the SED and on how well the SED was sampled by Dunham et al. (2015). While Herschel photometry was not available for the SED fits in Dunham et al. (2015), many of the protostars had 450 µm observations from SCUBA, some had 350 µm observations from SHARC-II on Caltech Submillimeter Observatory, and some brighter objects had Infrared Astronomical Satellite (IRAS) or Infrared Space Observatory (ISO) far-infrared photometry. Spitzer 70 µm photometry was also available for nearly the full Spitzer-GB sample, but at a spatial resolution lower than Herschel by a factor of 3, resulting in confusion for protostars with close neighbors. As a result, some Tbol values change by a large amount (~40%), while some change by a very small amount (≲10%). We present the Tbol from both eHOPS and Dunham et al. (2015) to quantify the range for the onset of protostellar disk substructures in Table A.1.
4 Results
4.1 Protostellar disk substructures versus Tbol and disk properties
Figure 1 illustrates the radius and mass of the protostellar disks as a function of bolometric temperature (Tbol) derived from the eHOPS catalog. The dashed black lines indicate the Tbol that marks the approximate boundary between the Class 0 and Class I evolutionary phases, and between the Class I and Class II ones (Chen et al. 1995), along with the corresponding expected duration of each Class (Dunham et al. 2015). For reference, we also include the sources that do not comply with the effective resolution criteria (θD/θres ≥ 4). The latter sources have, in general, smaller sizes and lower fluxes and masses.
The earliest substructure observed, IRAS 04169+2702, corresponds to a disk with an approximate age of 0.1–0.2 Myr (Tbol ~ 163 K). If we consider the lower limit of Tbol of CFHTWIR-Oph 79 (Tbol ~ 110 K), then the earliest substructure could be even younger5.
We find no detection of substructure in any of the Class 0 disks in the sample. Figure 2 shows the effective resolution and flux of the disks with and without substructures as a function of bolometric temperature, color-coded by the linear resolution. We can observe that the lack of substructure in Class 0 disks is evident across resolutions from 4 to 18 au.
Figures 3 and 4 show similar plots as Figures 1 and 2 but considering the upper limit on bolometric temperatures from Dunham et al. (2015). In that case, the earliest substructures discussed above correspond to Tbol of 163 and 300 K, for IRAS 04169+27026 and CFHTWIR-Oph79, respectively.
4.2 Disk substructure detection rates
We present the protostellar disk substructure detection rates as a function of bolometric temperature in Figure 5. Each disk is assigned a value of 1 if it exhibits substructures and 0 if it does not. We computed a moving average with a window size of 8, where the kernel slides through Tbol and calculates the mean for every group of eight disks. This means represents the substructure detection rate. Due to the fixed window size, the detection rates were sampled at discrete levels of 0/8, 1/8, 2/8, ..., up to 8/8 – effectively producing eight bins in the substructure detection rate space.
All 51 protostellar disks in Figure 5 are observed by ALMA Band 6 at a wavelength of 1.3 mm, have a disk diameter greater than four times the resolution (θD/θres ≥ 4), with an inclination angle of less than 75°, and a linear resolution of less than 20 au. We adopted the moving average with a window size of 8 to ensure a sufficient sampling resolution across Tbol and the substructure detection rate space. The blue and orange represent the case in which the bolometric temperature was adopted from eHOPS catalog and the Tbol from Dunham et al. (2015), respectively. The shaded region represents the uncertainty from the binomial counting uncertainty (σb), which was calculated as
 (1)
(1)
where r is the substructure detection rate, and n = 8 is the total number of sources in the window. The substructure detection rate adopting the Dunham et al. (2015) Tbol in general agrees with the results adopting the eHOPS Tbol, with a delay of ∼200 K in the rapid rise of the disk substructure detection rate at Tbol ∼ 200–400 K.
Figure 5 shows that the rate quickly reaches ~60% at Tbol of 200–400 K, clearly indicating that substructure during the Class I stage is not rare. The Class I protostellar disk substructure detection rate in Figure 5 is also consistent with the ~50% substructure detection rate in a sample of 62 Class II protoplane-tary disks observed with an effective resolution 3 < θD/θres ≤ 10 (Bae et al. 2023), strongly suggesting that the current detection rate of 60% from Tbol 200–400 K is only a lower limit given the more limited resolution of the younger disk sample (see Figure 2). The high Class I disk substructure detection rate supports the idea that the onset of disk substructures does not occur when disks transit into the Class II phases, but instead firmly into the Class I stage and possibly earlier (Section 5).
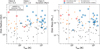 |
Fig. 1 Protostellar disk substructure detections as a function of disk radius, mass, and bolometric temperature. The latter was taken from the eHOPS catalog. The dashed gray lines indicate the approximate boundary between the Class 0 and Class I evolutionary phases, and between the Class I and Class II ones (Chen et al. 1995), along with the corresponding expected duration of each Class (Dunham et al. 2015). While the Tbol is not linear with age, in general the Class 0 sources have Tbol < 70 K, Class I sources have 70 < Tbol < 650 K, and Class II and Class III sources have Tbol > 650 K (Bouvier et al. 2021). The black arrow is used to indicate that the particular source has also been classified as Class II in the literature (Narayanan et al. 2023). |
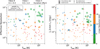 |
Fig. 2 Substructure detection as a function of effective resolution, 1.3 mm flux, and bolometric temperature, the latter from the eHOPS catalog. The black arrow is used to indicate that the particular source has also been classified as Class II in the literature (Narayanan et al. 2023). |
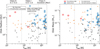 |
Fig. 3 Upper limit of the onset of disk substructures. Same as Figure 1, but the bolometric temperature was derived from the SED fitting without the Herschel Space Observatory data (70–500 µm) (Dunham et al. 2015). Extinction correction was applied to the infrared data, which further increased the bolometric temperature (Dunham et al. 2015). The effective resolution and the ALMA Band 6 1.3 mm flux of protostellar disks are color-coded and shown in different symbols according to the presence or absence of substructure. Compact disks with diameters smaller than four beams are indicated by crosses. The black arrow is used to indicate that the particular source has also been classified as Class II in the literature (Narayanan et al. 2023). |
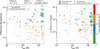 |
Fig. 4 Upper limit of the onset of disk substructures. Same as Figure 2, but the bolometric temperature was derived from the SED fitting without the Herschel Space Observatory data (70–500 µm) (Dunham et al. 2015). Extinction correction was applied to the infrared data, which further increases the bolometric temperature (Dunham et al. 2015). The crosses represent compact disks that are not well resolved with diameters less than four times the angular resolution of the observation (beams). The lower limit of the onset of the disk substructures at 200 K found in Figure 1 is also labeled. The black arrow is used to indicate that the particular source has also been classified as Class II in the literature (Narayanan et al. 2023). |
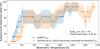 |
Fig. 5 Disk substructure detection rates versus the evolutionary stage traced by bolometric temperature. The blue and orange represent the lower and upper limits with the bolometric temperature (Tbol) measured by the eHOPS (with Herschel, but not extinction-corrected) and by Dunham et al. (2015) (no Herschel, but extinction corrected), respectively. The bin size of eight disks was used to compute the substructure detection rates. The shaded region represents the 1σ uncertainty from counting statistics. All 51 protostellar disks are observed by ALMA Band 6 at a wavelength of 1.3 mm, have a disk diameter greater than four times the resolution (θD/θres ≥ 4), with an inclination angle of less than 75°, and a linear resolution of less than 20 au. |
4.3 The protostellar disk substructures with and without central cavities
We found that some protostellar disks have a central cavity in the Class I and flat-spectrum phase. To further investigate this, we divided the substructure into two more general groups: the cavity type (C-type) and the centrally filled type (F-type). The cavitytype disk substructures exhibit large (>10 au) cleared central dust cavities. These C-type protostellar disk substructures display morphologies similar to the more evolved Class II/Class III transition disks (van der Marel et al. 2016b). The origin of the central dust cavity in transition disks can be attributed to a range of processes, such as extensive particle growth (Tanaka et al. 2005; Dullemond & Dominik 2005), photoevaporative massloss in winds (Clarke et al. 2001), dead zones (Regály et al. 2012), or embedded stellar or planetary companions (Ireland & Kraus 2008). In particular, in systems with super-Jovian planets or stellar binaries that can clear the material in disks, deep gas gaps are expected inside cavities in the disk dust distribution (Price et al. 2018; Muley et al. 2019; van der Marel et al. 2021). The other type of disk substructure population is the centrally filled type (F-type) disk substructure. In contrast to the C-type disk substructures, F-type disk substructures do not exhibit a central cavity.
Figure 6 shows these two types of substructures as a function of the evolutionary state. C-type disk substructures are found across all evolutionary stages from Class I to Class II. The detection of large cavities in younger Class I and flat-spectrum sources cannot be explained by photoevaporative mass-loss in winds (Clarke et al. 2001). Instead, the central cavity in Class I can possibly be explained by radial drift (Birnstiel et al. 2010; Cridland et al. 2017). In this scenario, dust particles experience a headwind due to the gas drag, drifting towards the central protostar (Cridland et al. 2017). Another explanation for these central cavities is tidal interactions with companions. The identification of binary systems in ALMA images relies on the presence of circumstellar disks around both components. While our ALMA data do not show evidence of binarity within the cavity of the C-type disks shown in Figure 6, we cannot exclude the presence of tight binary companions that either lack detectable dust disks or remain unresolved due to the linear resolution limit of 15 au. Protostellar disks with C-type disk substructures are good candidates to search for gap-opening protoplanets or close protobinaries.
Notably, we found that multiple-ring systems, which have at least two rings of a similar brightness within a factor of two at different disk radii, are almost always centrally filled (F-type). Among the 13 multiple-ring systems compiled from the literature (Andrews et al. 2018a; Cieza et al. 2021; Segura-Cox et al. 2020; Hsieh et al. 2024; ALMA Partnership 2015; Stephens et al. 2023; Huang et al. 2018), we found that the majority (10 out of 13 or 77%) are centrally filled (F-type), as is shown in Figure 7.
The three exceptions (HD 142666, HD 143006, and Sz 129) are among the oldest systems (Huang et al. 2018). Notably, the central cavities in these systems are significantly smaller than their disk sizes (Clarke et al. 2001). Multiple-ring systems with a large central cavity (≥25% of the disk diameter) are absent or very rare. The high fraction of F-type multiple-ring systems implies that a centrally filled disk is a general feature of multiple-ring systems.
In Figure 8, we examine the prevalence of central cavities (C-type) in protostellar disks as a function of disk mass, disk radius, and evolutionary stage, as is indicated by the bolometric temperature. For disks with substructures, each disk is assigned a value of 1 if it exhibits a central cavity (C-type) and 0 if it does not (F-type). We computed a moving average with a window size of 8, where the kernel slides through Tbol, disk radius, and disk mass, and calculated the mean for every group of 8 disks. This mean represents the fraction of disks with a central cavity (C-type).
Figure 8 shows that, in general, protostellar disks with a central cavity are smaller and less massive than those without a central cavity. Classifying disks with substructures into those with and without large central cavities, we find both populations coexisting across evolutionary stages. The fraction of protostel-lar disks with a central cavity stays roughly constant at around 40%.
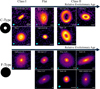 |
Fig. 6 Continuum images of “C-type” and “F-type” disks as a sequence of evolutionary class. Both types of disk substructures can be detected throughout the Class I to Class II phases. |
5 Discussion
5.1 Central cavities in protostellar disks: Whether disk substructures are evolutionarily linked
Cieza et al. (2021) propose that the diversity of disk substructures is evolutionarily linked and can be explained by giant planet formation via core accretion, coupled with simple dust evolution. Building upon this framework, Orcajo et al. (2025) conducted numerical simulations of protoplanetary disks to further establish the unified evolutionary sequence of planet-induced substructures. The evolutionary scenario proposed by both studies outlines five distinct stages, defined primarily by morphological features.
Classifying disk morphologies serves as a critical first step in examining this evolutionary sequence, analogous to the Hubble tuning fork used for galaxy classification. However, unlike galaxy classification, which relies on easily distinguishable features such as spiral versus elliptical structures, differentiating between stages of annular substructures is considerably more challenging due to their subtler morphological distinctions.
To test whether or not protostellar disk substructures are evo-lutionarily linked, as is argued by Cieza et al. (2021) and Orcajo et al. (2025), we adopted a binary classification scheme based on the presence (C-type) or absence (F-type) of a central cavity. This classification is advantageous due to its simplicity, robustness, and clarity. If disk substructures indeed evolve over time, as is proposed, we expect F-type disks to dominate in the earlier stages, with an increasing prevalence of C-type disks at later evolutionary stages.
By classifying disks with substructures into those with (C-type) and without (F-type) central cavities, we find that both populations coexist across evolutionary stages (Figure 8). Our results suggest that there is no clear, uniform evolutionary sequence in disk substructures. If the evolution of the disk substructures follows the unified evolutionary sequence proposed by Cieza et al. (2021) and Orcajo et al. (2025), then the data suggest that disk substructures evolve very rapidly and thus can be present in all Class I/II stages and/or that they can be triggered at different times. Alternatively, rather than representing an evolutionary path, the observed diversity could be explained by multiple distinct populations of disk substructures, shaped by different formation mechanisms.
We found that disks with a central cavity are, in general, smaller in size and less massive than disks without a central cavity. Most multi-ring systems fall into the F-type category, and multi-ring systems with a large central cavity (occupying at least 25% of the disk diameter) are exceedingly rare. A few notable exceptions include ISO-Oph 2a (Hsieh et al. 2024; González-Ruilova et al. 2020) and HD 169142 (Pérez et al. 2019), though these are atypical cases. HD 169142, for instance, is significantly older (∼10 Myr; Pohl et al. 2017) than the protostellar disks analyzed in this study (ages ≲ 1 Myr). This disk also hosts an embedded Jupiter-mass protoplanet, which interacts with the disk and likely contributes to the formation of a central cavity (Law et al. 2023). The other exception, ISO-Oph 2a, when observed at higher angular resolution, reveals two concentric rings (González-Ruilova et al. 2020). Recent multi-frequency ALMA observations show that this disk exhibits azimuthal temperature variations likely caused by a flyby interaction with a secondary companion (Casassus et al. 2023). The morphology of ISO-Oph 2a, shaped by dynamical interactions, differs significantly from that of the other multi-ring systems presented in Figure 7.
We speculate that the two populations of disk substructures are related to different planetary systems architectures, formed through different mechanisms, and will possibly evolve into different types of planetary systems. The recent discovery of the first protoplanetary system, PDS 70, revealed two giant planets located at 20 and 35 au from the host star (Keppler et al. 2018; Haffert et al. 2019). In contrast, our Solar System is much more compact, with Jupiter at ∼5 au and Saturn at ∼10 au. Jupiter formed much closer to the Sun at ∼3 au before entering a resonance with Saturn and eventually migrating to its current position, as is suggested in the grand track model (Walsh et al. 2011). The formation of Jupiter-like giant planets would create a strong pressure bump around the planet, blocking millimetersized dust grains and preventing the dust in the outer disk from replenishing the inner disk. Over time, this causes the inner disk to dissipate completely, forming a central cavity (Zhu et al. 2012; Pinilla et al. 2016). Thus, protostellar disks with C-type substructures might form compact planetary systems that resemble our Solar System.
On the other hand, the gaps and rings in the multiple-rings system imaged by ALMA (F-type) are located much further away, at tens of astronomical units from the host star. The location of these gaps and rings contrasts with the distribution of giant planets’ orbits, which peaks at 3 au as measured by the California Legacy Survey (Fulton et al. 2021). These multiplering systems are also larger and more massive than the disks with a central cavity, suggesting that they might be the precursors of extended planetary systems like PDS 70. Alternatively, simulations show that multiple gaps and rings can be generated by a single planet inside a low-viscosity disk (Dong et al. 2017; Zhang et al. 2018) or explained by various instabilities (see Bae et al. 2023 for a review). We hypothesize that some of the F-type multiple-ring disks with shallower gaps originated from various instabilities or low-mass planets inside a low-viscosity disk. In contrast, disks with a central cavity (C-type) are more likely to be associated with giant planet formation than disks without a central cavity are.
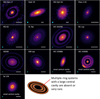 |
Fig. 7 Dust continuum images of disks with multiple rings in our sample and the literature. Most of the multiple-ring systems are centrally filled (F-type) (Andrews et al. 2018a; Cieza et al. 2021; Ohashi et al. 2023; Hsieh et al. 2024; Cieza et al. 2019; ALMA Partnership 2015; Stephens et al. 2023). The lack of a large central cavity (≥25% of the disk diameter) implies that a centrally filled disk is a general feature of multiple-ring systems. The cyan circle represents the beam size. The white lines mark the scale of 50 au. Note that HD 163296, RU Lup, AS 209, GW Lup, HD 142666, HD 143006, and Sz 129 either do not have reliable bolometric temperature (Tbol) measurements or their Tbol ≥ 1900 K, thus are not included in this study. |
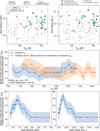 |
Fig. 8 Upper panel: protostellar disk substructure with or without a central cavity as a function of disk radius, mass, and bolometric temperature. Middle panel: fraction of disk with a central cavity versus the evolutionary stage traced by bolometric temperature. Bottom panel: fraction of disk with a central cavity versus the disk mass and radius. The bin size of eight disks was used to compute the fraction. The shaded region represents the 1σ uncertainty from counting statistics. All 24 protostellar disks are observed by ALMA Band 6 at a wavelength of 1.3 mm have a disk diameter greater than four times the resolution (θD/θres ≥ 4), with an inclination angle of less than 75°, and have substructures, and linear resolutions of less than 20 au. |
5.2 The onset of protostellar disk substructures
Since the discovery of rings and gaps in the HL Tau proto-planetary disk (ALMA Partnership 2015), many more evolved protoplanetary disks substructures (rings, gaps, spirals) have been detected (e.g., Long et al. 2018; Tsukagoshi et al. 2019; Pinilla et al. 2017; van der Plas et al. 2017; van der Marel et al. 2016a; Kudo et al. 2018; Pinilla et al. 2018; Guzmán et al. 2018; van Terwisga et al. 2018; Fedele et al. 2017; Leiendecker et al. 2022; Booth et al. 2024; Shi et al. 2024; Huang et al. 2024; Guerra-Alvarado et al. 2025). Guerra-Alvarado et al. (2025) recently observed over 73 Class II disks in the Lupus molecular cloud at a resolution of 4 au, and found that the substructure detection rate strongly depends on the effective resolution. For disks with sizes between 8 and 30 au (2 ≤ θD/θres ≤ 7.5), the substructure detection rate is approximately 40%, whereas it increases to ∼80% for disks larger than 30 au (θD/θres ≥ 7.5) (Guerra-Alvarado et al. 2025). Although many Class II disks are compact (Guerra-Alvarado et al. 2025), the majority of Class II protoplanetary disks observed at a high linear (a few astronomical units) and effective resolution (θD/θres ≥ 7.5) exhibit substructures (Andrews et al. 2018a; Huang et al. 2018; Bae et al. 2023; Guerra-Alvarado et al. 2025). The high substructure detection rate in well-resolved Class II disks indicates that substructures are already widespread by the Class II stage (Bae et al. 2023).
The quest to search for disk substructures in the Class 0/I protostellar phase has generated a great interest in the disk community (Aso et al. 2021; Xu et al. 2023; Lee et al. 2023; Maureira et al. 2024; Michel et al. 2023; Ohashi et al. 2023). In particular, the recent ALMA Large Program, eDisk, has made a significant contribution, surveying around 20 embedded Class 0/I protostel-lar disks, and found that three of the disks in their sample have substructures (L1489 IRS, Oph IRS 63, and IRAS 04169+2702) (Ohashi et al. 2023). Among these, substructures in Oph IRS 63 and L1489 IRS had previously been reported (Segura-Cox et al. 2020; Ohashi et al. 2022). Based on the prevalence of Class 0/I disks without substructures (detection rate 3 out of 20), Ohashi et al. (2023) concluded that substructures form rapidly near the Class I/II transition.
Our analysis of 90 protostellar disks from CAMPOS, incorporating observations from eDISK, ODISEA, and DSHARP, shows that detection rates for Class I and Class II disks become comparable at Tbol ∼ 200–400 K. In this study, we have accounted for potential biases, including variations in observational resolution and source inclination. A lower resolution and higher inclination can artificially reduce the visibility of disk substructures, disproportionately affecting the detection of younger disks in current high-resolution surveys. We have also considered possible systematic biases, such as the lack of extinction correction or Herschel data, on the bolometric temperature of each source. Our finding is consistent with the recent study of protostellar disks in the Ophiuchus molecular cloud by Shoshi et al. (2025), which found that disk substructure starts to appear when Tbol exceeds 200–300 K. The onset of disk substructure at Tbol ∼ 200–400 K corresponds to an approximate age of ∼0.2–0.4 Myr, which is much earlier than the age of ∼1 Myr – the expected age for when the transition between Class I and Class II takes place (Evans et al. 2009; Dunham et al. 2015).
It is important to note that the onset of disk substructures in this study could be an upper limit, and the actual onset of disk substructures may occur much earlier, within the Class 0 phase. We took a conservative approach and did not count sources that show small power variations as a function of distance in uv-space or small variations in the intensity radial profile but appear smooth in the image plane as disks with substructures (e.g., TMC-1Aspiral7: Aso et al. 2021; Xu et al. 2023, HH211 spiral8: Lee et al. (2023), Oph A SM1 gap9: Maureira et al. (2024), faint rings in Oph-emb-6, Oph-emb-9, and GSS 30 IRS 310: Michel et al. (2023). Our conservative approach minimizes the chances of false positives, but we may miss lower-contrast (shallower) substructures in younger disks with borderline detection. Furthermore, another possible reason for this onset being an upper limit is the choice to include all disks with θD/θres ≥ 4, since the detection rate is only ~50% for values between 3 < θD/θres ≤ 10 (Bae et al. 2023).
In addition, optical depth can also affect the detection rate of substructures in younger Class 0 or early Class I disks (e.g., Maureira et al. 2024). To investigate this possibility further, we estimated the optical depth at 1.3 mm of our disks by computing the ratio between brightness temperature (TB,planck) and the dust temperature. We estimated the brightness temperature of the disk from the average disk intensity using the full Planck equation. The estimated brightness temperature as a function of evolution stage (Tbol) is plotted in the left panel of Figure 9. We then compared it with the dust temperature given by
 (2)
(2)
where Lbol is the bolometric luminosity (Tobin et al. 2020). The optical depth (τν) follows the following relationship:
 (3)
(3)
For optically thick disks, the Tbright,planck/Tdust ratio is expected to be close to 1. In the right panel of Figure 9, we plot the Tbright,planck/Tdust ratio as a function of the evolutionary stage.
Although we do not find a sharp transition in optical depth between Class 0 and I, there is an indication of optical depth increasing from Class I back into the Class 0 stage. The median brightness temperature to dust temperature ratio (Tbright,planck/Tdust) for Class 0 sources is 0.36, which is higher than that of Class I sources (70 ≤ Tbol ≤ 650 K), at 0.23, and Class II sources (Tbol ≥ 650 K), at 0.27. This supports the idea that the zero detection rate in our large sample for Tbol ≤ 163 K might be affected by high optical depths at 1.3 mm. Further suggestive of this is the fact that the disks with detected substructures in our work seem to have, on average, less estimated optical depth than all the remaining disks with no substructures during the Class 0 and I stages. If the Class 0 protostellar disks are optically thick, then the onset of protostellar disk substructures likely occurs even earlier.
The rapid formation of disk substructures at early Class I phases suggests that protostars and protoplanets grow and evolve together. During the Class 0 and early Class I phases, the central protostar and protostellar disks are constantly fed by anisotropic infall via streamers (Pineda et al. 2020; Valdivia-Mena et al. 2022; Pineda et al. 2023). This anisotropic infall can perturb the protostellar disks, generating vortices and pressure bumps, resulting in substructure formation (Kuznetsova et al. 2022). These earliest disk substructures may be triggered by anisotropic infall (Kuznetsova et al. 2022; Zhao et al. 2025). Other mechanisms for substructure formation have also been proposed (see Bae et al. (2023) for a review). While we do not know the origin of these early disk substructures, these structures can possibly trigger subsequent giant planet formation (Lau et al. 2024). The early onset of protostellar disk substructures at ∼0.2–0.4 Myr is also consistent with recent population synthesis models, which show that rapid substructure formation within 0.4 Myr is needed to explain the observed spectral index distribution in Lupus pro-toplanetary disks (Delussu et al. 2024). Our findings of the early formation of disk substructures at early Class I phases confirm that star formation sets the initial conditions for planet formation in protostellar disks.
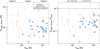 |
Fig. 9 Left: brightness temperature of the protostellar disks calculated from the full Planck equation as a function of the evolutionary stage (bolometric temperature). Right: transition between disks with substructures and without substructures at Tbol ∼ 200 K, which is not due to the optical depth. We do not see a discontinuity for the brightness temperature to dust temperature ratio (Tbright,Planck/Tdust) at 200 K. For optically thick disks, the Tbright,Planck/Tdust ratio should be close to 1 (horizontal black line). We adopted the dust temperature from Equation (1), and excluded the circumbinary disks. |
6 Conclusion
In summary, our ALMA study reveals that by Tbol ∼ 200–400 K protostellar disk substructure detection rates increase sharply to ∼60%. Our statistical analysis confirms that substructures similar to the ones in Class II disks are already common by the Class I stage. We argue that this emergence is likely only an upper age limit, as our study suggests increasing optical depth toward the earliest stages.
The prevalence of substructures in the early protostellar stage suggests that planetesimals and giant planets form much more efficiently and earlier than was predicted by traditional models (e.g., Pollack et al. 1996). This early planet formation scenario is also supported by a low abundance of water in the inner Solar System (Morbidelli et al. 2016; Hyodo et al. 2019), the existence of several isotopic reservoirs in the Solar System (Kruijer et al. 2017), and the distribution of calcium-aluminum-rich inclusions (Desch et al. 2018; Brasser & Mojzsis 2020). Additionally, older protoplanetary disks (around Class II sources) might not have enough dust mass to form planetary systems (Manara et al. 2018). Our study has pushed the onset of planet formation to the much earlier protostellar phase, in ∼0.2–0.4 Myr disks. During this time period, the central protostar still has a high accretion rate and is building up its mass.
In addition, by classifying disks with substructures into those with (C-type) and without (F-type) central cavities, we find that both populations coexist across evolutionary stages. If protostel-lar disk substructures are evolutionarily linked, then the data suggest that disk substructures evolve very rapidly and thus can be present at both Class I and Class II stages, and/or that they can be triggered at different times. Alternatively, the observed diversity could be explained by multiple distinct populations of disk substructures, shaped by different formation mechanisms.
Data availability
All data used in this study are public and can be downloaded from the ALMA Science Archive. Tables A.1, Table A.2, and Table A.3 are available at the CDS via https://cdsarc.cds.unistra.fr/viz-bin/cat/J/A+A/700/A235
Acknowledgements
C.H.H. and H.A. are supported in part by NSF grants AST-1714710. C.H.H. is supported by the NASA Hubble Fellowship Program under award HF2-51556. D.S.C. is supported by an NSF Astronomy and Astrophysics Postdoctoral Fellowship under award AST-2102405. Special thanks to the eHOPS group, Dr. Riwaj Pokhrel, and Dr. Thomas Megeath for providing the unpublished e-HOPs catalog for protostar classification. C.H.H. thanks Dr. Sean Andrews for the suggestion of considering the effective resolution in constructing a homogeneous sample for this statistical study. We also want to thank the referee for the insightful comments and discussion. This paper makes use of the following ALMA data: ADS/JAO. ALMA #2016.1.00484.L, #2018.1.00028.S, #2019.1.00261.L, #2019.1.01792.S. ALMA is a partnership of the ESO (representing its member states), NSF(USA), and NINS (Japan), together with the NRC (Canada), NSC and ASIAA (Taiwan), and KASI (Republic of Korea), in cooperation with the Republic of Chile. The Joint ALMA Observatory is operated by the ESO, AUI/NRAO, and NAOJ. The National Radio Astronomy Observatory is a facility of the National Science Foundation operated under cooperative agreement by Associated Universities, Inc. This paper makes use of the following software: Astropy: Greenfield et al. (2013); Astropy Collaboration (2018, 2022), CASA: McMullin et al. (2007), SciPy: Virtanen et al. (2020).
Appendix A Supplementary materials
In Table A.1, we present all the disks in this study compiled from the CAMPOS survey (Hsieh et al. 2024), eDisk survey (Ohashi et al. 2023), DSHARP survey (Andrews et al. 2018a), and ODISEA survey (Cieza et al. 2021, 2019). The protostel-lar systems in this study have bolometric temperatures less than 1900 K, and inclination angles less than 75°. The Table consists of a homogeneous survey of 5 molecular clouds, Corona Australis, Chamaeleon I & II, Ophiuchus & Ophiuchus North, with additional sources in Taurus, Lupus I and BHR 71 from the literature.
In Table A.2, we cross-match all the Corona Australis, Chamaeleon I & II, Ophiuchus North, and Ophiuchus sources in our CAMPOS survey with the Young Stellar Objects catalog from the Spitzer Space Telescope c2d and GB Legacy surveys (Dunham et al. 2015), as well as the Extension of HOPS Out to 500 ParSecs (eHOPS) catalog to obtain the bolometric temperature (Tbol), which serves as a proxy for relative evolutionary age for embedded protostellar systems. The eHOPS catalog contains 1–850 µm SEDs assembled from 2MASS, Spitzer, Herschel, WISE, and JCMT/SCUBA-2 data. It represents the latest and most reliable SED fitting to date. The first eHOPS paper, covering the Serpens and Aquila molecular clouds, was published by Pokhrel et al. (2023). For all other clouds, the SED and the pro-tostellar system properties are available in NASA/IPAC Infrared Science Archive.
In Table A.3, we cross-matched all the sources from the ODISEA survey (Cieza et al. 2019) with the Spitzer Space Telescope c2d and GB Legacy surveys (Dunham et al. 2015), as well as the eHOPS survey (Pokhrel et al. 2023), to obtain bolometric temperature and luminosity. Nine protostellar disks have bolometric temperature measurements but are unresolved in the ODISEA survey (Cieza et al. 2019) and are therefore not included in Table A.1.
Appendix B Bolometric temperature as a proxy for relative evolutionary age
Tracing protostellar disk age is extremely difficult. For embedded protostars, the luminosity is dominated by accretion, resulting in a large spread in observed luminosity. This means individual protostellar ages cannot be directly determined from traditional isochrone fitting. Instead, the age sequence for protostellar disks is based on the dissipation of the protostellar envelope, as indicated by observables such as bolometric temperature (Tbol) (Chen et al. 1995; Myers & Ladd 1993).
Tbol is the temperature of a blackbody having the same flux-weighted mean frequency as the observed continuum spectrum (Chen et al. 1995). As a protostar evolves toward the main sequence, the circumstellar envelope dissipates, shifting the Tbol to a higher temperature. We followed the standard method (Wilking 1989; Dunham et al. 2015) to estimate the age for the onset of the protostellar disk substructures (at Tbol = 200, 400 K). The standard approach for determining the duration of each evolutionary class involves calculating the ratio of the number of sources in the evolutionary stage of interest to the number in a reference stage, and then multiplying this ratio by the duration of the reference evolutionary class (Dunham et al. 2015; Wilking et al. 1989; Evans et al. 2009; Dunham et al. 2014). Following Evans et al. (2009), Dunham et al. (2014) and Dunham et al. (2015), we adopted Class II as the reference evolutionary class and assumed a Class II duration of 2 million years. We used the Spitzer Space Telescope c2d and Gould Belt Legacy survey (gbs) catalog of 3000 young stellar objects in the 18 molecular clouds to estimate the age (Dunham et al. 2015). We divided the number of protostars with bolometric temperatures less than 200 and 400 K by the total number of protostars in Class 0, Class I, flat-spectrum phase, and Class II phase combined. We multiplied this ratio by 2 million years to obtain the corresponding age of 0.2-0.3 Myr, and 0.3-0.4 Myr, at Tbol = 200,400 K, respectively.
Note that this commonly used number-counting method does not take into account different star-formation rates in different molecular clouds, assumes a steady state constant star formation rate, and treats the duration of each stage as a single value rather than a distribution (Kristensen & Dunham 2018). Evans et al. (2009) developed the idea that the protostellar lifetimes should be thought of as half-lives, in which they represent the timescales at which half of the objects will have moved through and left that Tbol range. Kristensen & Dunham (2018) accounted for a nonsteady state star formation rate and adopted a sequential nuclear decay model to estimate the duration of each protostellar stage, and found that the half-life of Class 0 and Class I are ~4.7 × 10⁴ and ~8.7 × 10⁴ years, respectively.
If we adopt the duration from Kristensen & Dunham (2018), the onset of disk substructure will occur much earlier. In this paper, we adopt a more conservative number-counting method for the age estimate. We also emphasize that the age estimate for the onset of protostellar disk substructures is only a zeroth-order estimate, and future work is needed to improve the Tbol -age relation.
References
- ALMA Partnership (Brogan, C. L., et al.) 2015, ApJ, 808, L3 [Google Scholar]
- Andrews, S. M., Huang, J., Pérez, L. M., et al. 2018a, ApJ, 869, L41 [NASA ADS] [CrossRef] [Google Scholar]
- Andrews, S. M., Terrell, M., Tripathi, A., et al. 2018b, ApJ, 865, 157 [Google Scholar]
- Aso, Y., Kwon, W., Hirano, N., et al. 2021, ApJ, 920, 71 [NASA ADS] [CrossRef] [Google Scholar]
- Astropy Collaboration (Price-Whelan, A. M., et al.) 2018, AJ, 156, 123 [Google Scholar]
- Astropy Collaboration (Price-Whelan, A. M., et al.) 2022, ApJ, 935, 167 [NASA ADS] [CrossRef] [Google Scholar]
- Bae, J., Isella, A., Zhu, Z., et al. 2023, in Astronomical Society of the Pacific Conference Series, 534, Protostars and Planets VII, eds. S. Inutsuka, Y. Aikawa, T. Muto, K. Tomida, & M. Tamura, 423 [Google Scholar]
- Birnstiel, T., Dullemond, C. P., & Brauer, F. 2010, A&A, 513, A79 [NASA ADS] [CrossRef] [EDP Sciences] [Google Scholar]
- Booth, A. S., Leemker, M., van Dishoeck, E. F., et al. 2024, AJ, 167, 164 [NASA ADS] [CrossRef] [Google Scholar]
- Bouvier, M., López-Sepulcre, A., Ceccarelli, C., et al. 2021, A&A, 653, A117 [CrossRef] [EDP Sciences] [Google Scholar]
- Brasser, R., & Mojzsis, S. J. 2020, Nat. Astron., 4, 492 [NASA ADS] [CrossRef] [Google Scholar]
- Casassus, S., Cieza, L., Cárcamo, M., et al. 2023, MNRAS, 526, 1545 [NASA ADS] [CrossRef] [Google Scholar]
- Chen, H., Myers, P. C., Ladd, E. F., & Wood, D. O. S. 1995, ApJ, 445, 377 [NASA ADS] [CrossRef] [Google Scholar]
- Chung, C.-Y., Andrews, S. M., Gurwell, M. A., et al. 2024, ApJS, 273, 29 [NASA ADS] [CrossRef] [Google Scholar]
- Cieza, L. A., Casassus, S., Pérez, S., et al. 2017, ApJ, 851, L23 [Google Scholar]
- Cieza, L. A., Ruíz-Rodríguez, D., Hales, A., et al. 2019, MNRAS, 482, 698 [Google Scholar]
- Cieza, L. A., González-Ruilova, C., Hales, A. S., et al. 2021, MNRAS, 501, 2934 [Google Scholar]
- Clarke, C. J., Gendrin, A., & Sotomayor, M. 2001, MNRAS, 328, 485 [NASA ADS] [CrossRef] [Google Scholar]
- Cridland, A. J., Pudritz, R. E., & Birnstiel, T. 2017, MNRAS, 465, 3865 [Google Scholar]
- Delussu, L., Birnstiel, T., Miotello, A., et al. 2024, A&A, 688, A81 [NASA ADS] [CrossRef] [EDP Sciences] [Google Scholar]
- Desch, S. J., Kalyaan, A., & O’D Alexander, C. M. 2018, ApJS, 238, 11 [NASA ADS] [CrossRef] [Google Scholar]
- Dong, R., Li, S., Chiang, E., & Li, H. 2017, ApJ, 843, 127 [Google Scholar]
- Dullemond, C. P., & Dominik, C. 2005, A&A, 434, 971 [CrossRef] [EDP Sciences] [Google Scholar]
- Dunham, M. M., Stutz, A. M., Allen, L. E., et al. 2014, in Protostars and Planets VI, eds. H. Beuther, R. S. Klessen, C. P. Dullemond, & T. Henning, 195 [Google Scholar]
- Dunham, M. M., Allen, L. E., Evans, Neal J. I., et al. 2015, ApJS, 220, 11 [NASA ADS] [CrossRef] [Google Scholar]
- Evans, Neal J. I., Dunham, M. M., Jørgensen, J. K., et al. 2009, ApJS, 181, 321 [NASA ADS] [CrossRef] [Google Scholar]
- Fedele, D., Carney, M., Hogerheijde, M. R., et al. 2017, A&A, 600, A72 [NASA ADS] [CrossRef] [EDP Sciences] [Google Scholar]
- Fulton, B. J., Rosenthal, L. J., Hirsch, L. A., et al. 2021, ApJS, 255, 14 [NASA ADS] [CrossRef] [Google Scholar]
- González-Ruilova, C., Cieza, L. A., Hales, A. S., et al. 2020, ApJ, 902, L33 [Google Scholar]
- Greenfield, P., Robitaille, T., Tollerud, E., et al. 2013, Astropy: Community Python library for astronomy, Astrophysics Source Code Library [record ascl:1304.002] [Google Scholar]
- Guerra-Alvarado, O. M., van der Marel, N., Williams, J. P., et al. 2025, A&A, 696, A232 [NASA ADS] [CrossRef] [EDP Sciences] [Google Scholar]
- Guzmán, V. V., Huang, J., Andrews, S. M., et al. 2018, ApJ, 869, L48 [Google Scholar]
- Haffert, S. Y., Bohn, A. J., de Boer, J., et al. 2019, Nat. Astron., 3, 749 [Google Scholar]
- Hsieh, C.-H., Arce, H. G., Maureira, M. J., et al. 2024, ApJ, 973, 138 [NASA ADS] [CrossRef] [Google Scholar]
- Huang, J., Andrews, S. M., Dullemond, C. P., et al. 2018, ApJ, 869, L42 [NASA ADS] [CrossRef] [Google Scholar]
- Huang, J., Ansdell, M., Birnstiel, T., et al. 2024, ApJ, 976, 132 [Google Scholar]
- Hyodo, R., Ida, S., & Charnoz, S. 2019, A&A, 629, A90 [NASA ADS] [CrossRef] [EDP Sciences] [Google Scholar]
- Ireland, M. J., & Kraus, A. L. 2008, ApJ, 678, L59 [CrossRef] [Google Scholar]
- Jin, S., Li, S., Isella, A., Li, H., & Ji, J. 2016, ApJ, 818, 76 [CrossRef] [Google Scholar]
- Keppler, M., Benisty, M., Müller, A., et al. 2018, A&A, 617, A44 [NASA ADS] [CrossRef] [EDP Sciences] [Google Scholar]
- Kristensen, L. E., & Dunham, M. M. 2018, A&A, 618, A158 [NASA ADS] [CrossRef] [EDP Sciences] [Google Scholar]
- Kruijer, T. S., Burkhardt, C., Budde, G., & Kleine, T. 2017, PNAS, 114, 6712 [NASA ADS] [CrossRef] [Google Scholar]
- Kudo, T., Hashimoto, J., Muto, T., et al. 2018, ApJ, 868, L5 [NASA ADS] [CrossRef] [Google Scholar]
- Kuznetsova, A., Bae, J., Hartmann, L., & Mac Low, M.-M. 2022, ApJ, 928, 92 [NASA ADS] [CrossRef] [Google Scholar]
- Lau, T. C. H., Birnstiel, T., Drkaz˙ kowska, J., & Stammler, S. M. 2024, A&A, 688, A22 [NASA ADS] [CrossRef] [EDP Sciences] [Google Scholar]
- Law, C. J., Booth, A. S., & Öberg, K. I. 2023, ApJ, 952, L19 [NASA ADS] [CrossRef] [Google Scholar]
- Lee, C.-F., Jhan, K.-S., & Moraghan, A. 2023, ApJ, 951, L2 [Google Scholar]
- Leiendecker, H., Jang-Condell, H., Turner, N. J., & Myers, A. D. 2022, ApJ, 941, 172 [NASA ADS] [CrossRef] [Google Scholar]
- Li, J. I.-H., Liu, H. B., Hasegawa, Y., & Hirano, N. 2017, ApJ, 840, 72 [NASA ADS] [CrossRef] [Google Scholar]
- Lin, Z.-Y. D., Lee, C.-F., Li, Z.-Y., Tobin, J. J., & Turner, N. J. 2021, MNRAS, 501, 1316 [Google Scholar]
- Long, F., Pinilla, P., Herczeg, G. J., et al. 2018, ApJ, 869, 17 [Google Scholar]
- Manara, C. F., Morbidelli, A., & Guillot, T. 2018, A&A, 618, L3 [NASA ADS] [CrossRef] [EDP Sciences] [Google Scholar]
- Martí-Vidal, I., Pérez-Torres, M. A., & Lobanov, A. P. 2012, A&A, 541, A135 [NASA ADS] [CrossRef] [EDP Sciences] [Google Scholar]
- Maureira, M. J., Gong, M., Pineda, J. E., et al. 2022, ApJ, 941, L23 [NASA ADS] [CrossRef] [Google Scholar]
- Maureira, M. J., Pineda, J. E., Liu, H. B., et al. 2024, A&A, 689, L5 [NASA ADS] [CrossRef] [EDP Sciences] [Google Scholar]
- McMullin, J. P., Waters, B., Schiebel, D., Young, W., & Golap, K. 2007, in Astronomical Society of the Pacific Conference Series, 376, Astronomical Data Analysis Software and Systems XVI, eds. R. A. Shaw, F. Hill, & D. J. Bell, 127 [Google Scholar]
- Michel, A., Sadavoy, S. I., Sheehan, P. D., et al. 2023, AJ, 166, 184 [NASA ADS] [CrossRef] [Google Scholar]
- Mie, G. 1908, Ann. Phys., 330, 377 [Google Scholar]
- Miotello, A., Kamp, I., Birnstiel, T., Cleeves, L. C., & Kataoka, A. 2023, in Astronomical Society of the Pacific Conference Series, 534, Protostars and Planets VII, eds. S. Inutsuka, Y. Aikawa, T. Muto, K. Tomida, & M. Tamura, 501 [Google Scholar]
- Morbidelli, A., Bitsch, B., Crida, A., et al. 2016, Icarus, 267, 368 [Google Scholar]
- Muley, D., Fung, J., & van der Marel, N. 2019, ApJ, 879, L2 [NASA ADS] [CrossRef] [Google Scholar]
- Myers, P. C., & Ladd, E. F. 1993, ApJ, 413, L47 [NASA ADS] [CrossRef] [Google Scholar]
- Narayanan, S., Williams, J. P., Tobin, J. J., et al. 2023, ApJ, 958, 20 [NASA ADS] [CrossRef] [Google Scholar]
- Ohashi, S., Kobayashi, H., Sai, J., & Sakai, N. 2022, ApJ, 933, 23 [NASA ADS] [CrossRef] [Google Scholar]
- Ohashi, N., Tobin, J. J., Jørgensen, J. K., et al. 2023, ApJ, 951, 8 [NASA ADS] [CrossRef] [Google Scholar]
- Orcajo, S., Cieza, L. A., Guilera, O., et al. 2025, ApJ, 984, L57 [Google Scholar]
- Pérez, S., Casassus, S., Baruteau, C., et al. 2019, AJ, 158, 15 [Google Scholar]
- Pineda, J. E., Segura-Cox, D., Caselli, P., et al. 2020, Nat. Astron., 4, 1158 [NASA ADS] [CrossRef] [Google Scholar]
- Pineda, J. E., Arzoumanian, D., Andre, P., et al. 2023, in Astronomical Society of the Pacific Conference Series, 534, Protostars and Planets VII, eds. S. Inutsuka, Y. Aikawa, T. Muto, K. Tomida, & M. Tamura, 233 [Google Scholar]
- Pinilla, P., Klarmann, L., Birnstiel, T., et al. 2016, A&A, 585, A35 [NASA ADS] [CrossRef] [EDP Sciences] [Google Scholar]
- Pinilla, P., Pérez, L. M., Andrews, S., et al. 2017, ApJ, 839, 99 [Google Scholar]
- Pinilla, P., Tazzari, M., Pascucci, I., et al. 2018, ApJ, 859, 32 [Google Scholar]
- Pohl, A., Benisty, M., Pinilla, P., et al. 2017, ApJ, 850, 52 [Google Scholar]
- Pokhrel, R., Megeath, S. T., Gutermuth, R. A., et al. 2023, ApJS, 266, 32 [NASA ADS] [CrossRef] [Google Scholar]
- Pollack, J. B., Hubickyj, O., Bodenheimer, P., et al. 1996, Icarus, 124, 62 [NASA ADS] [CrossRef] [Google Scholar]
- Price, D. J., Cuello, N., Pinte, C., et al. 2018, MNRAS, 477, 1270 [Google Scholar]
- Regály, Z., Juhász, A., Sándor, Z., & Dullemond, C. P. 2012, MNRAS, 419, 1701 [Google Scholar]
- Sakai, N., Hanawa, T., Zhang, Y., et al. 2019, Nature, 565, 206 [NASA ADS] [CrossRef] [Google Scholar]
- Segura-Cox, D. M., Schmiedeke, A., Pineda, J. E., et al. 2020, Nature, 586, 228 [NASA ADS] [CrossRef] [Google Scholar]
- Sheehan, P. D., Tobin, J. J., Federman, S., Megeath, S. T., & Looney, L. W. 2020, ApJ, 902, 141 [Google Scholar]
- Shi, Y., Long, F., Herczeg, G. J., et al. 2024, ApJ, 966, 59 [Google Scholar]
- Shoshi, A., Yamaguchi, M., Muto, T., et al. 2025, PASJ, submitted [arXiv:2503.21060] [Google Scholar]
- Stephens, I. W., Lin, Z.-Y. D., Fernández-López, M., et al. 2023, Nature, 623, 705 [NASA ADS] [CrossRef] [Google Scholar]
- Tanaka, H., Himeno, Y., & Ida, S. 2005, ApJ, 625, 414 [NASA ADS] [CrossRef] [Google Scholar]
- Tazzari, M., Clarke, C. J., Testi, L., et al. 2021, MNRAS, 506, 2804 [NASA ADS] [CrossRef] [Google Scholar]
- Tobin, J. J., Sheehan, P. D., Megeath, S. T., et al. 2020, ApJ, 890, 130 [CrossRef] [Google Scholar]
- Tsukagoshi, T., Momose, M., Kitamura, Y., et al. 2019, ApJ, 871, 5 [NASA ADS] [CrossRef] [Google Scholar]
- Valdivia-Mena, M. T., Pineda, J. E., Segura-Cox, D. M., et al. 2022, A&A, 667, A12 [NASA ADS] [CrossRef] [EDP Sciences] [Google Scholar]
- van der Marel, N., van Dishoeck, E. F., Bruderer, S., et al. 2016a, A&A, 585, A58 [NASA ADS] [CrossRef] [EDP Sciences] [Google Scholar]
- van der Marel, N., Verhaar, B. W., van Terwisga, S., et al. 2016b, A&A, 592, A126 [NASA ADS] [CrossRef] [EDP Sciences] [Google Scholar]
- van der Marel, N., Birnstiel, T., Garufi, A., et al. 2021, AJ, 161, 33 [Google Scholar]
- van der Plas, G., Ménard, F., Canovas, H., et al. 2017, A&A, 607, A55 [NASA ADS] [CrossRef] [EDP Sciences] [Google Scholar]
- van Terwisga, S. E., van Dishoeck, E. F., Ansdell, M., et al. 2018, A&A, 616, A88 [NASA ADS] [CrossRef] [EDP Sciences] [Google Scholar]
- Virtanen, P., Gommers, R., Oliphant, T. E., et al. 2020, Nat. Methods, 17, 261 [Google Scholar]
- Walsh, K. J., Morbidelli, A., Raymond, S. N., O’Brien, D. P., & Mandell, A. M. 2011, Nature, 475, 206 [Google Scholar]
- Wilking, B. A. 1989, PASP, 101, 229 [Google Scholar]
- Wilking, B. A., Lada, C. J., & Young, E. T. 1989, ApJ, 340, 823 [NASA ADS] [CrossRef] [Google Scholar]
- Williams, J. P., Cieza, L., Hales, A., et al. 2019, ApJ, 875, L9 [Google Scholar]
- Xu, W., Ohashi, S., Aso, Y., & Liu, H. B. 2023, ApJ, 954, 190 [NASA ADS] [CrossRef] [Google Scholar]
- Zamponi, J., Maureira, M. J., Zhao, B., et al. 2021, MNRAS, 508, 2583 [NASA ADS] [CrossRef] [Google Scholar]
- Zamponi, J., Maureira, M. J., Liu, H. B., et al. 2024, A&A, 682, A56 [NASA ADS] [CrossRef] [EDP Sciences] [Google Scholar]
- Zhang, S., Zhu, Z., Huang, J., et al. 2018, ApJ, 869, L47 [Google Scholar]
- Zhao, H., Lau, T. C. H., Birnstiel, T., Stammler, S. M., & Draz˙kowska, J. 2025, A&A, 694, A205 [NASA ADS] [CrossRef] [EDP Sciences] [Google Scholar]
- Zhu, Z., Nelson, R. P., Dong, R., Espaillat, C., & Hartmann, L. 2012, ApJ, 755, 6 [Google Scholar]
θres is estimated by taking the geometric mean of the FWHM of the major (θmaj) and minor (θmin) axes of the synthesized beam, that is θres =  .
.
We assume thin circular disks and use the major-to-minor axis ratio of the dust continuum data to compute the inclination angle (i), that is i = sin−1(Rmin/Rmaj) × 180°/π.
These sources are DoAr 20, Oph-emb-20, CFHTWIR-Oph 79, IRS 2, SMM 2, ISO-ChaI 101, ISO-ChaI 207, shown in Table A.1.
The lower limit of the Tbol from this source corresponds to the calculation from eHOPS. On the other hand, in the literature, this source has been classified as a Class II, hence the lower limit.
For IRAS 04169+2702, the Tbol is adopted from Ohashi et al. (2023).
We did not include TMC-1A as a substructure source because it was not identified as a disk with a spiral substructure in the eDisk survey (Ohashi et al. 2023), in contrast to Xu et al. (2023).
HH211 is not included in Table A.1, because it is an edge-on source.
Oph A SM1 is not included in Table A.1 because it does not have a bolometric temperature measurement.
Ring-like structures are not visually identifiable by the naked eye in Oph-emb-6, Oph-emb-9, and GSS 30 IRS 3 (Michel et al. 2023; Hsieh et al. 2024).
All Figures
|
Fig. 1 Protostellar disk substructure detections as a function of disk radius, mass, and bolometric temperature. The latter was taken from the eHOPS catalog. The dashed gray lines indicate the approximate boundary between the Class 0 and Class I evolutionary phases, and between the Class I and Class II ones (Chen et al. 1995), along with the corresponding expected duration of each Class (Dunham et al. 2015). While the Tbol is not linear with age, in general the Class 0 sources have Tbol < 70 K, Class I sources have 70 < Tbol < 650 K, and Class II and Class III sources have Tbol > 650 K (Bouvier et al. 2021). The black arrow is used to indicate that the particular source has also been classified as Class II in the literature (Narayanan et al. 2023). |
| In the text | |
|
Fig. 2 Substructure detection as a function of effective resolution, 1.3 mm flux, and bolometric temperature, the latter from the eHOPS catalog. The black arrow is used to indicate that the particular source has also been classified as Class II in the literature (Narayanan et al. 2023). |
| In the text | |
|
Fig. 3 Upper limit of the onset of disk substructures. Same as Figure 1, but the bolometric temperature was derived from the SED fitting without the Herschel Space Observatory data (70–500 µm) (Dunham et al. 2015). Extinction correction was applied to the infrared data, which further increased the bolometric temperature (Dunham et al. 2015). The effective resolution and the ALMA Band 6 1.3 mm flux of protostellar disks are color-coded and shown in different symbols according to the presence or absence of substructure. Compact disks with diameters smaller than four beams are indicated by crosses. The black arrow is used to indicate that the particular source has also been classified as Class II in the literature (Narayanan et al. 2023). |
| In the text | |
|
Fig. 4 Upper limit of the onset of disk substructures. Same as Figure 2, but the bolometric temperature was derived from the SED fitting without the Herschel Space Observatory data (70–500 µm) (Dunham et al. 2015). Extinction correction was applied to the infrared data, which further increases the bolometric temperature (Dunham et al. 2015). The crosses represent compact disks that are not well resolved with diameters less than four times the angular resolution of the observation (beams). The lower limit of the onset of the disk substructures at 200 K found in Figure 1 is also labeled. The black arrow is used to indicate that the particular source has also been classified as Class II in the literature (Narayanan et al. 2023). |
| In the text | |
|
Fig. 5 Disk substructure detection rates versus the evolutionary stage traced by bolometric temperature. The blue and orange represent the lower and upper limits with the bolometric temperature (Tbol) measured by the eHOPS (with Herschel, but not extinction-corrected) and by Dunham et al. (2015) (no Herschel, but extinction corrected), respectively. The bin size of eight disks was used to compute the substructure detection rates. The shaded region represents the 1σ uncertainty from counting statistics. All 51 protostellar disks are observed by ALMA Band 6 at a wavelength of 1.3 mm, have a disk diameter greater than four times the resolution (θD/θres ≥ 4), with an inclination angle of less than 75°, and a linear resolution of less than 20 au. |
| In the text | |
|
Fig. 6 Continuum images of “C-type” and “F-type” disks as a sequence of evolutionary class. Both types of disk substructures can be detected throughout the Class I to Class II phases. |
| In the text | |
|
Fig. 7 Dust continuum images of disks with multiple rings in our sample and the literature. Most of the multiple-ring systems are centrally filled (F-type) (Andrews et al. 2018a; Cieza et al. 2021; Ohashi et al. 2023; Hsieh et al. 2024; Cieza et al. 2019; ALMA Partnership 2015; Stephens et al. 2023). The lack of a large central cavity (≥25% of the disk diameter) implies that a centrally filled disk is a general feature of multiple-ring systems. The cyan circle represents the beam size. The white lines mark the scale of 50 au. Note that HD 163296, RU Lup, AS 209, GW Lup, HD 142666, HD 143006, and Sz 129 either do not have reliable bolometric temperature (Tbol) measurements or their Tbol ≥ 1900 K, thus are not included in this study. |
| In the text | |
|
Fig. 8 Upper panel: protostellar disk substructure with or without a central cavity as a function of disk radius, mass, and bolometric temperature. Middle panel: fraction of disk with a central cavity versus the evolutionary stage traced by bolometric temperature. Bottom panel: fraction of disk with a central cavity versus the disk mass and radius. The bin size of eight disks was used to compute the fraction. The shaded region represents the 1σ uncertainty from counting statistics. All 24 protostellar disks are observed by ALMA Band 6 at a wavelength of 1.3 mm have a disk diameter greater than four times the resolution (θD/θres ≥ 4), with an inclination angle of less than 75°, and have substructures, and linear resolutions of less than 20 au. |
| In the text | |
|
Fig. 9 Left: brightness temperature of the protostellar disks calculated from the full Planck equation as a function of the evolutionary stage (bolometric temperature). Right: transition between disks with substructures and without substructures at Tbol ∼ 200 K, which is not due to the optical depth. We do not see a discontinuity for the brightness temperature to dust temperature ratio (Tbright,Planck/Tdust) at 200 K. For optically thick disks, the Tbright,Planck/Tdust ratio should be close to 1 (horizontal black line). We adopted the dust temperature from Equation (1), and excluded the circumbinary disks. |
| In the text | |
Current usage metrics show cumulative count of Article Views (full-text article views including HTML views, PDF and ePub downloads, according to the available data) and Abstracts Views on Vision4Press platform.
Data correspond to usage on the plateform after 2015. The current usage metrics is available 48-96 hours after online publication and is updated daily on week days.
Initial download of the metrics may take a while.