Fig. 4
Download original image
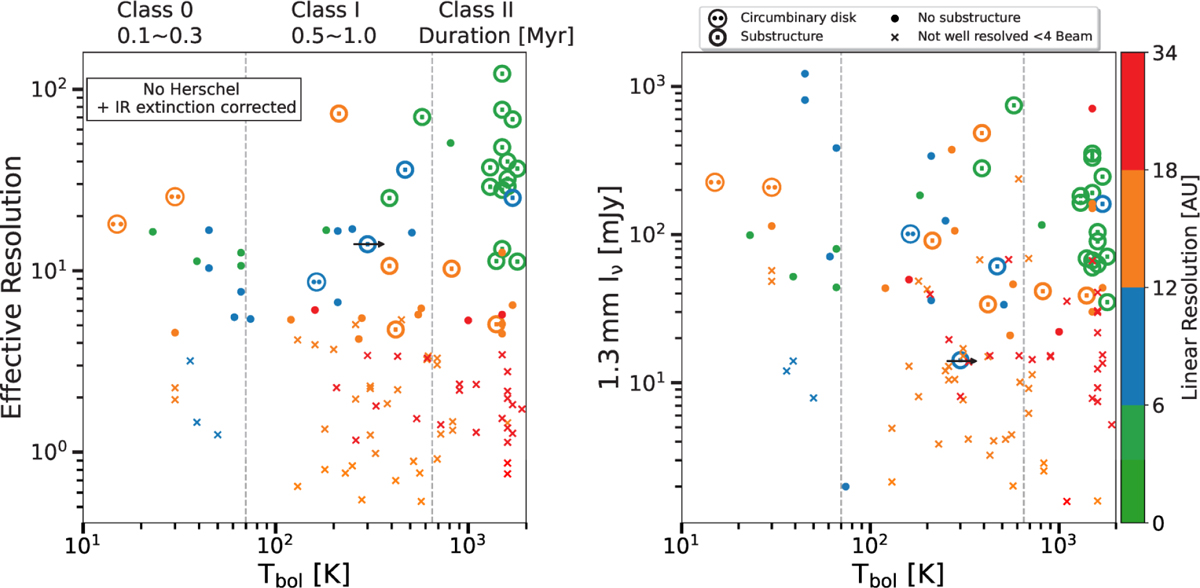
Upper limit of the onset of disk substructures. Same as Figure 2, but the bolometric temperature was derived from the SED fitting without the Herschel Space Observatory data (70–500 µm) (Dunham et al. 2015). Extinction correction was applied to the infrared data, which further increases the bolometric temperature (Dunham et al. 2015). The crosses represent compact disks that are not well resolved with diameters less than four times the angular resolution of the observation (beams). The lower limit of the onset of the disk substructures at 200 K found in Figure 1 is also labeled. The black arrow is used to indicate that the particular source has also been classified as Class II in the literature (Narayanan et al. 2023).
Current usage metrics show cumulative count of Article Views (full-text article views including HTML views, PDF and ePub downloads, according to the available data) and Abstracts Views on Vision4Press platform.
Data correspond to usage on the plateform after 2015. The current usage metrics is available 48-96 hours after online publication and is updated daily on week days.
Initial download of the metrics may take a while.