Fig. 21
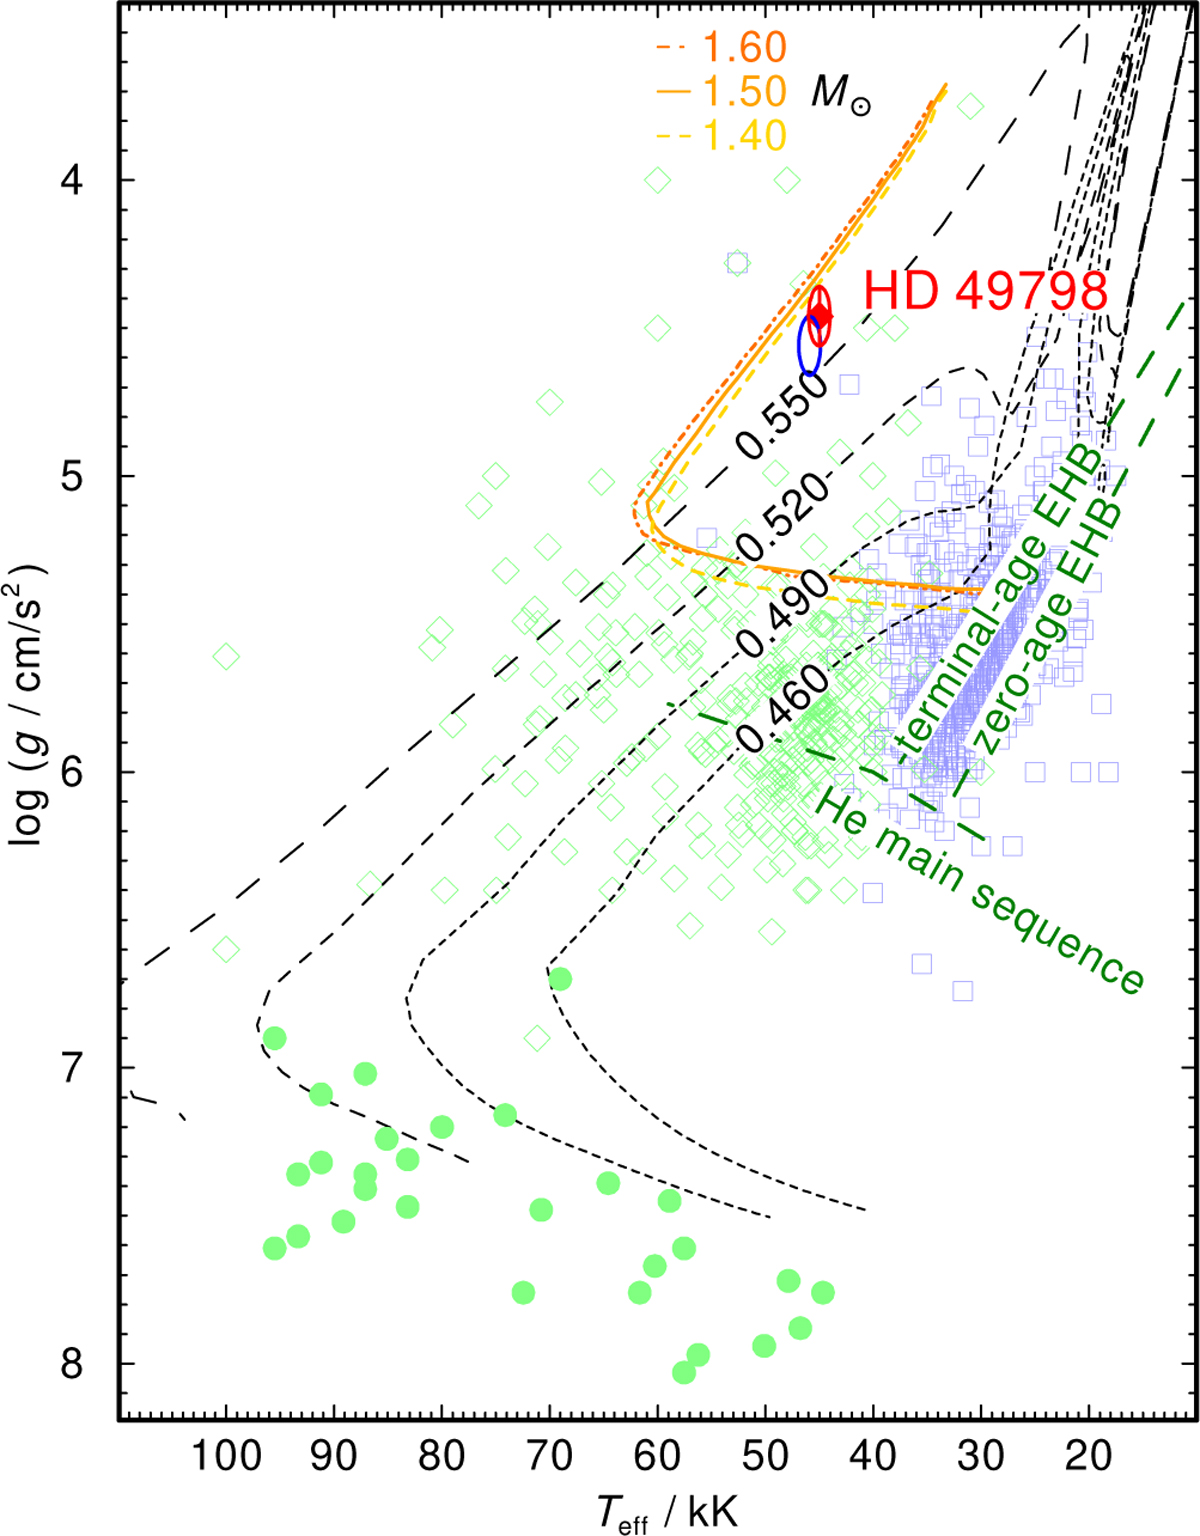
Download original image
Location of HD 49798 (red error ellipse) in the log Teff−log g plane compared with three MESA models for the evolution of He cores with different masses (orange tracks, evolution towards lower log g, taken from Brooks et al. 2017). The blue error ellipse shows the error limits of Krtička et al. (2019). Positions of sdB (Geier et al. 2017, blue, open squares), sdO stars (Geier 2020, green, open rhombs), and Hrich WDs (Gianninas et al. 2010, green, dashed lines) are indicated. Four post-EHB evolutionary tracks, labeled with the stellar mass in M☉, (Dorman et al. 1993, blue, dashed lines for Y = 0.459 ≈ 1.6 × Y☉) are shown to indicate their evolution. The dashed green lines indicate the He main sequence and the zero- and terminal-age EHB.
Current usage metrics show cumulative count of Article Views (full-text article views including HTML views, PDF and ePub downloads, according to the available data) and Abstracts Views on Vision4Press platform.
Data correspond to usage on the plateform after 2015. The current usage metrics is available 48-96 hours after online publication and is updated daily on week days.
Initial download of the metrics may take a while.