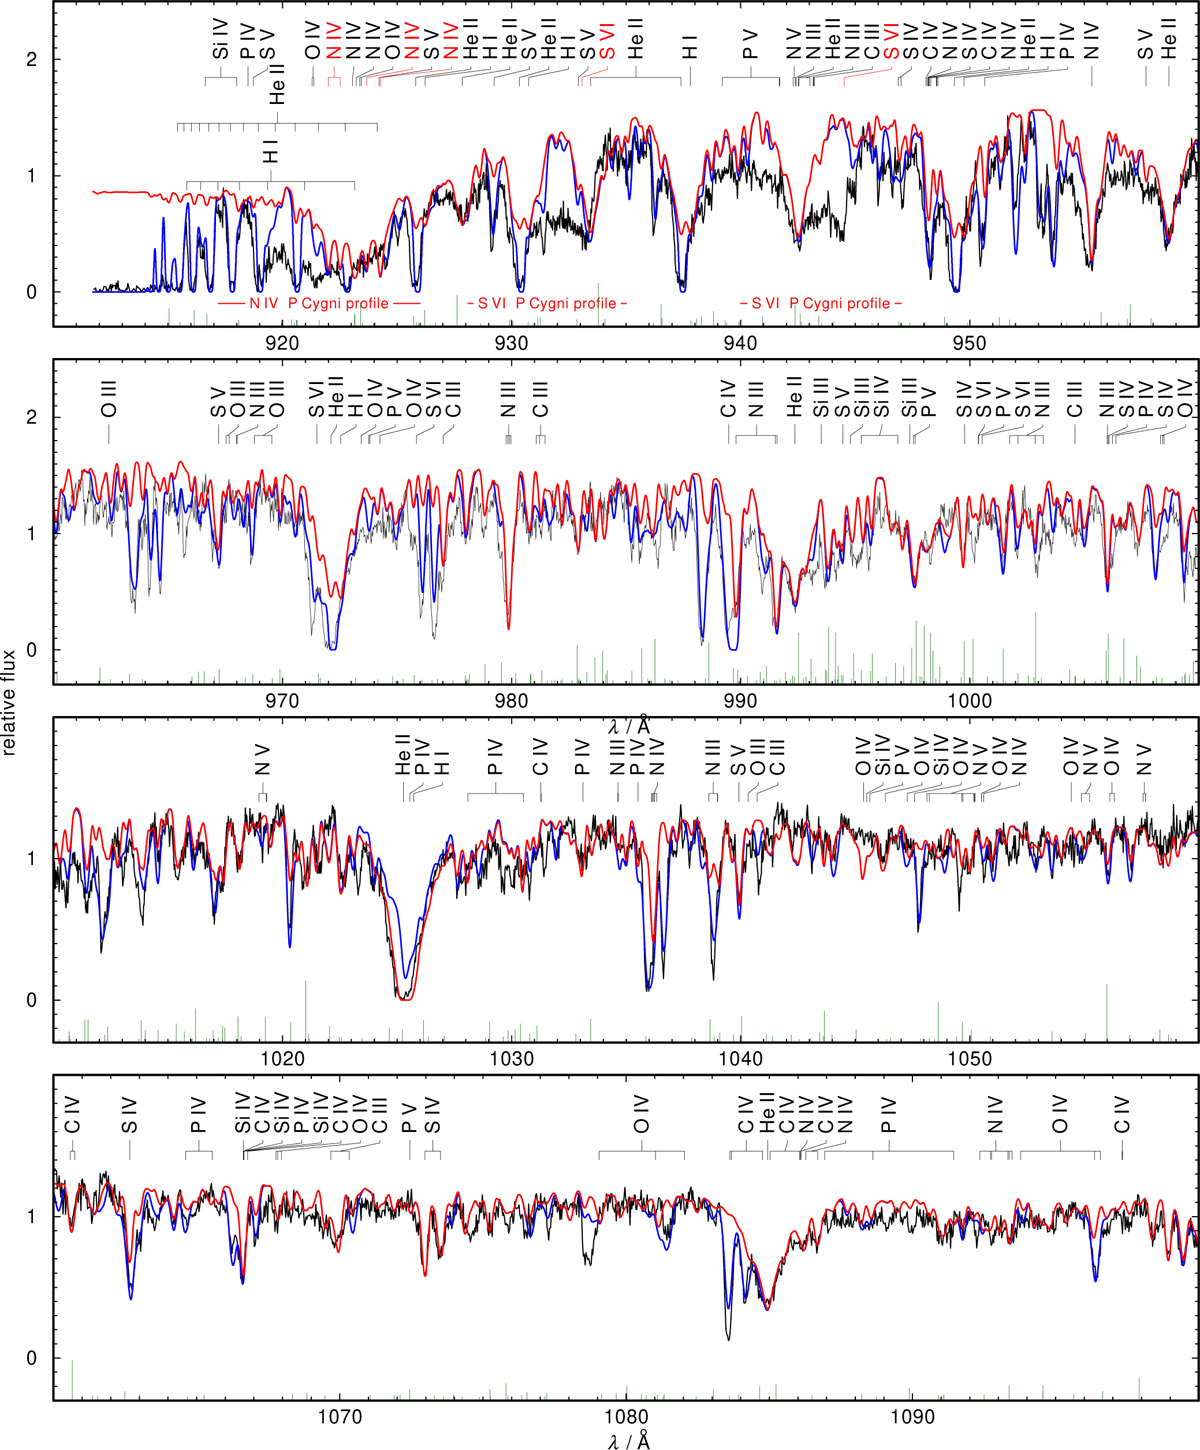
Fig. A.1
Download original image
ORFEUS II observation (black) compared with our best model with (blue) and without (red) interstellar line absorption considered. vrad = 140 km/s and vrot = 37.5 km/s are applied to our model. Stellar lines are identified at top. Prominent PCyg profiles of N IV λ λ 922.0, 922.5, 923.1, 924.3Å, N V λ λ 1238.8, 1242.8 Å, and S VI λ λ 933.4, 944.5Å are indicated by horizontal bars. The green marks at the bottom of each panel indicate wavelengths and strengths (mark lengths ∼ log g f value of the respective line) of prominent iron-group (Ca−Ni) lines.
Current usage metrics show cumulative count of Article Views (full-text article views including HTML views, PDF and ePub downloads, according to the available data) and Abstracts Views on Vision4Press platform.
Data correspond to usage on the plateform after 2015. The current usage metrics is available 48-96 hours after online publication and is updated daily on week days.
Initial download of the metrics may take a while.