Fig. 10.
Download original image
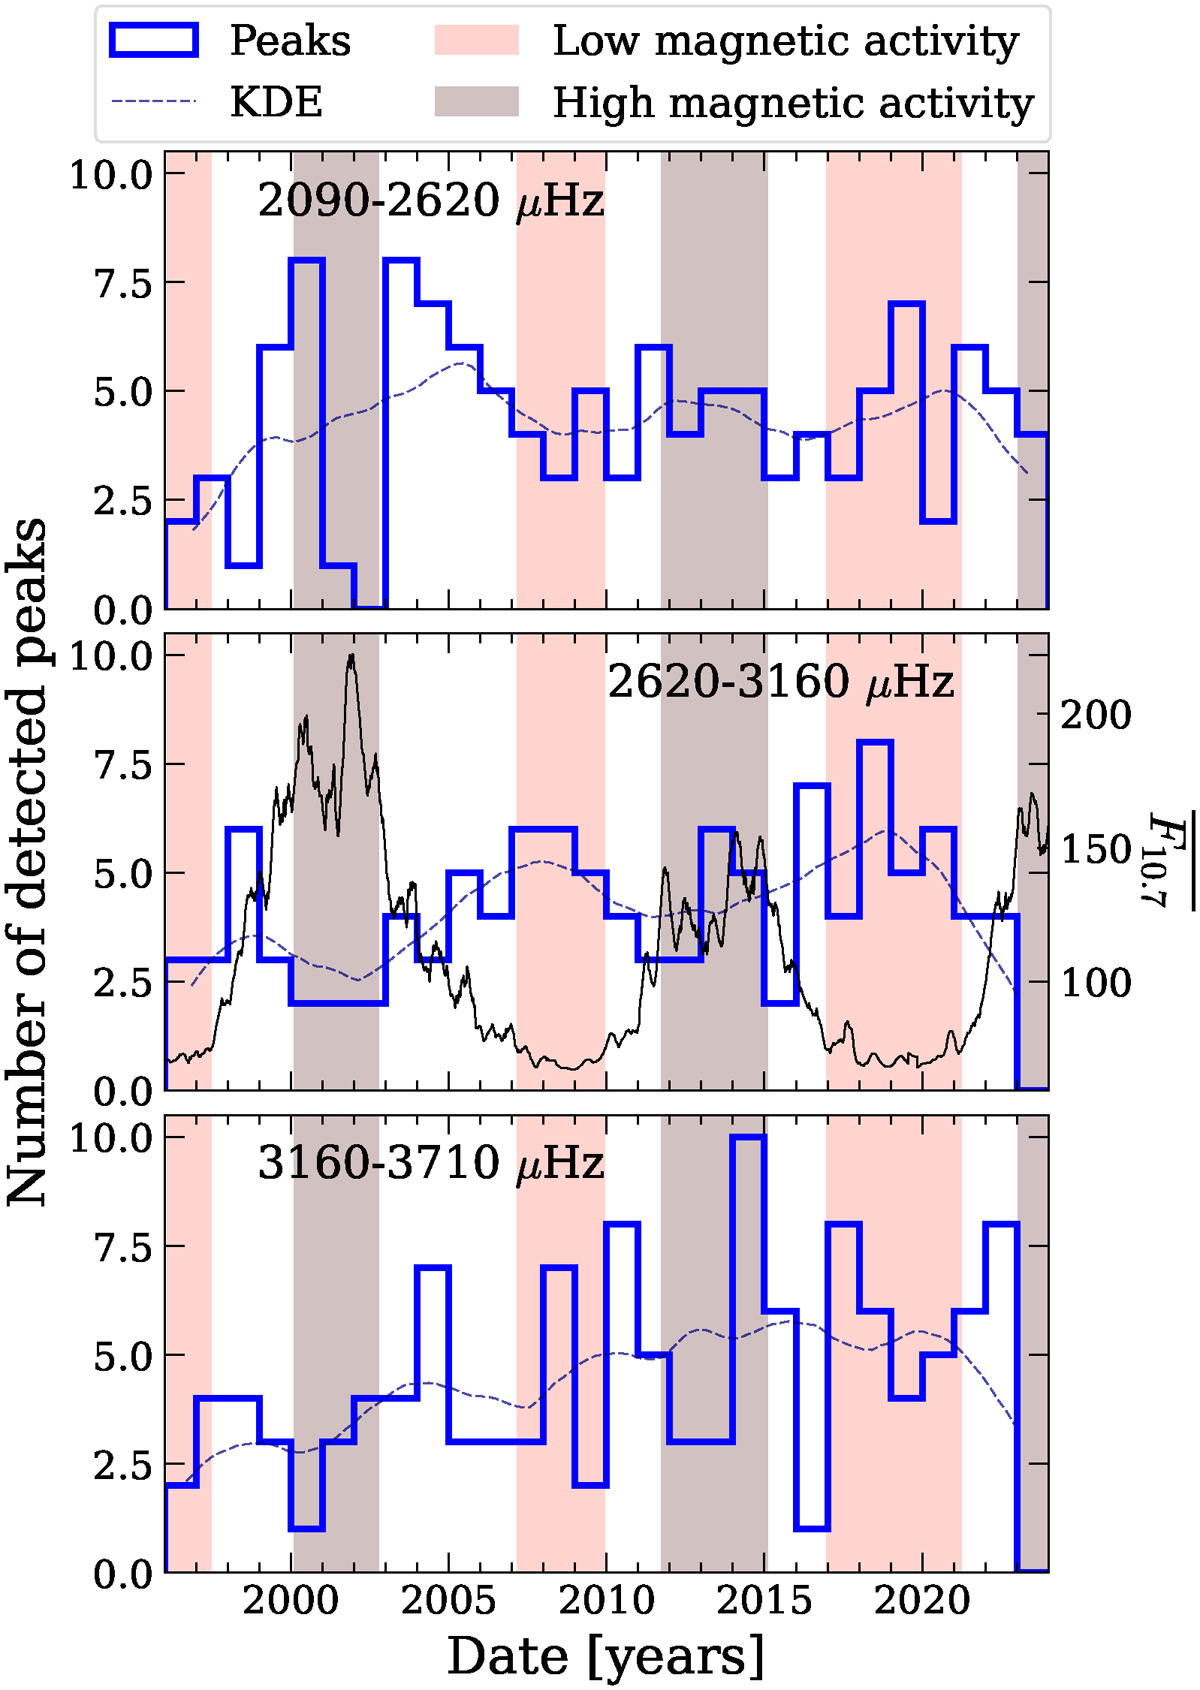
Distribution of the detected peaks over time for the three frequency bands, from top to bottom: 2090–2620 μHz, 2620–3160 μHz, and 3160–3710 μHz. Each bin corresponds to one year from 1995 to 2025. Dashed curve shows the Epanechnikov kernel density estimations (KDE) of the probability distributions from each histogram. Periods of low and high magnetic activity were reported from Table 2 and ![]() is reported in black, in the middle panel, for comparisons.
is reported in black, in the middle panel, for comparisons.
Current usage metrics show cumulative count of Article Views (full-text article views including HTML views, PDF and ePub downloads, according to the available data) and Abstracts Views on Vision4Press platform.
Data correspond to usage on the plateform after 2015. The current usage metrics is available 48-96 hours after online publication and is updated daily on week days.
Initial download of the metrics may take a while.