Fig. B.1.
Download original image
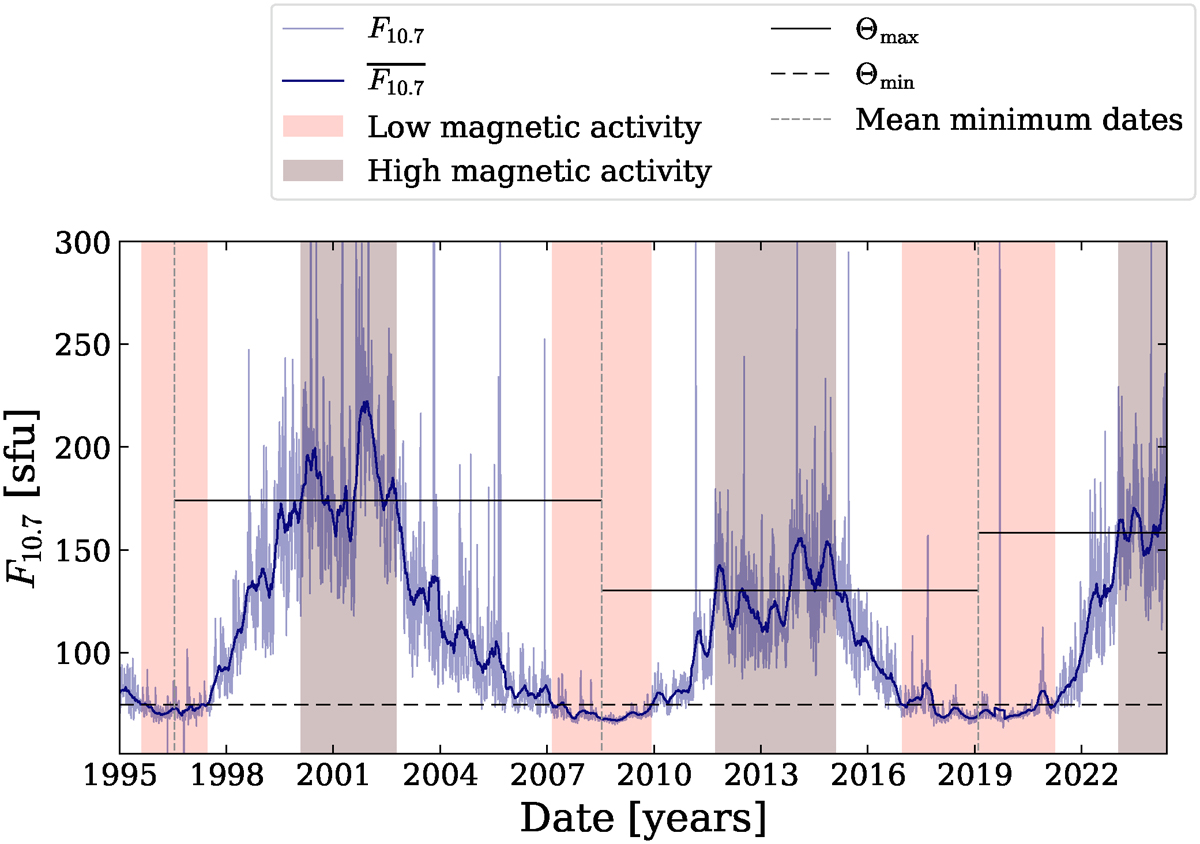
Proxy for the solar magnetic activity: the solar radio-flux given by the F10.7 index (Tapping 2013) is shown in transparent blue. The dark blue curve shows the mean solar radio-flux filtered with a 101-days window ![]() . Black lines indicate thresholds (higher than quantiles at 85 % for periods of high magnetic activity in continuous lines, and lower than the quantile at 20 % for low magnetic activity in dashed line). Epochs used for high magnetic activity dates determination are separated by dashed grey lines that correspond to the mean minimum date of each cycle. Epochs of high and low magnetic activity are highlighted in brown and pink zones and reported in later Figures and in Table 2.
. Black lines indicate thresholds (higher than quantiles at 85 % for periods of high magnetic activity in continuous lines, and lower than the quantile at 20 % for low magnetic activity in dashed line). Epochs used for high magnetic activity dates determination are separated by dashed grey lines that correspond to the mean minimum date of each cycle. Epochs of high and low magnetic activity are highlighted in brown and pink zones and reported in later Figures and in Table 2.
Current usage metrics show cumulative count of Article Views (full-text article views including HTML views, PDF and ePub downloads, according to the available data) and Abstracts Views on Vision4Press platform.
Data correspond to usage on the plateform after 2015. The current usage metrics is available 48-96 hours after online publication and is updated daily on week days.
Initial download of the metrics may take a while.