Fig. 2.
Download original image
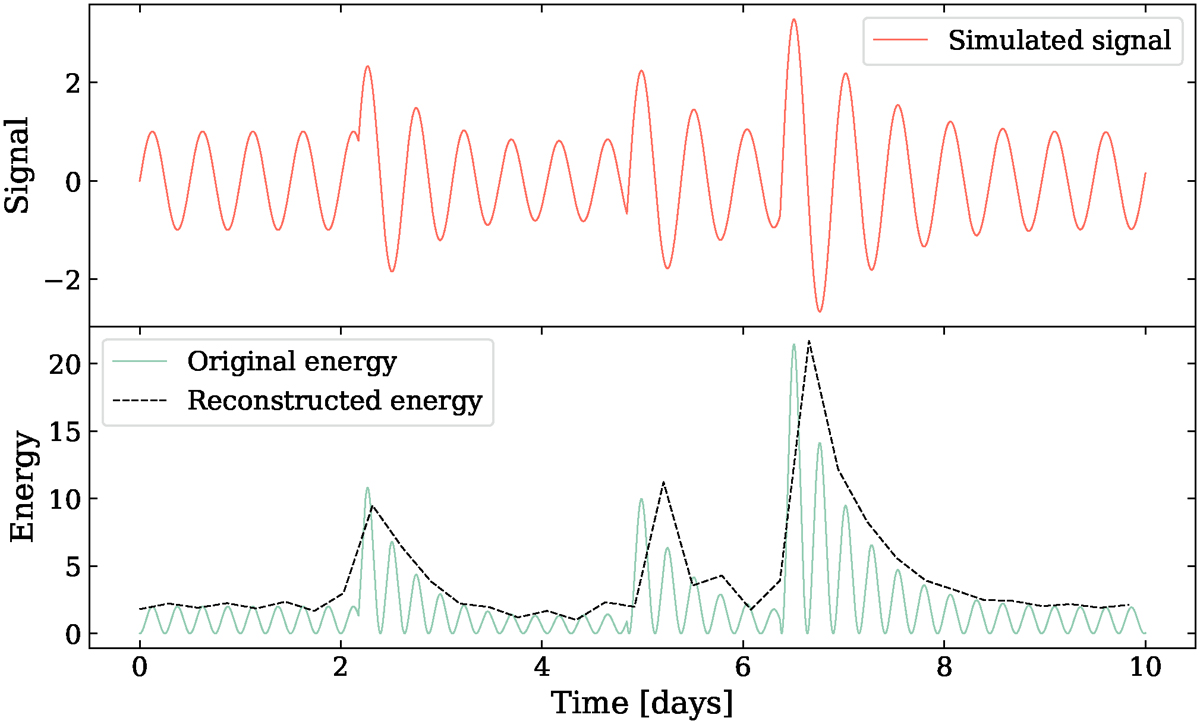
Top panel: Simulated sinusoidal signal S(t) with a period of 0.5 days and three excitations randomly distributed in time. It is shown for a time series of 10 days sampled at 60 seconds. The excitations are exponentially decaying. Bottom panel: Energy E(t) = 2|S(t)|2 corresponding to the simulated signal is shown in grey and the reconstructed energy is shown in dashed black.
Current usage metrics show cumulative count of Article Views (full-text article views including HTML views, PDF and ePub downloads, according to the available data) and Abstracts Views on Vision4Press platform.
Data correspond to usage on the plateform after 2015. The current usage metrics is available 48-96 hours after online publication and is updated daily on week days.
Initial download of the metrics may take a while.