Fig. 5.
Download original image
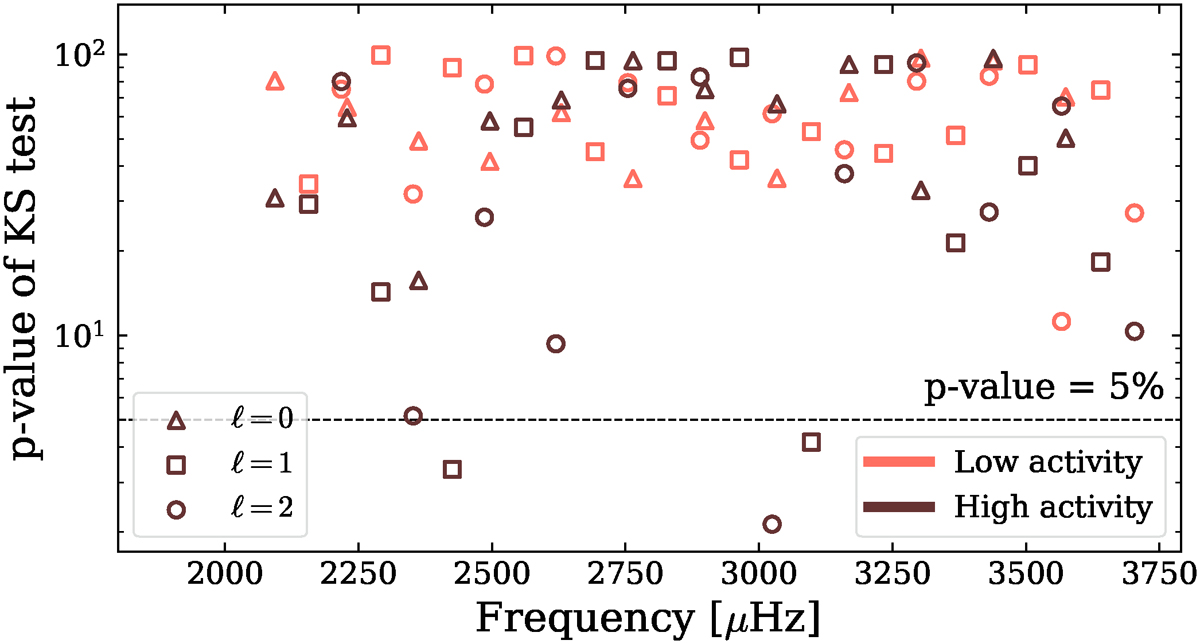
Resulting p-values of the Kolmogorov-Smirnov tests comparing reconstructed time series distributions with exponential distributions, for measurements taken during low and high magnetic activity periods whose dates are listed in Table 2. Triangles stand for ℓ = 0 modes, squares for ℓ = 1 modes, and circles for ℓ = 2 modes. Brown and pink makers stand for tests on values taken during high (resp. low) magnetic activity. The threshold of rejection of 5% is drawn as a dashed black line.
Current usage metrics show cumulative count of Article Views (full-text article views including HTML views, PDF and ePub downloads, according to the available data) and Abstracts Views on Vision4Press platform.
Data correspond to usage on the plateform after 2015. The current usage metrics is available 48-96 hours after online publication and is updated daily on week days.
Initial download of the metrics may take a while.