Fig. 8.
Download original image
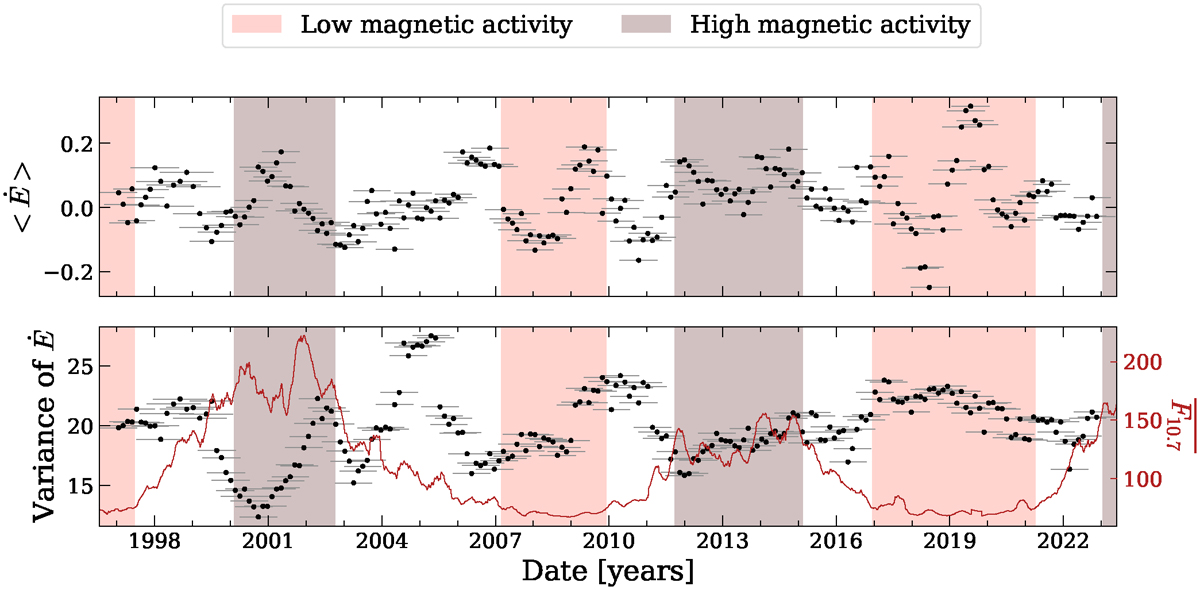
Mean (top panel) and variance (bottom panel) of a one-year subseries slided every eighth of a year of the energy supply rate computed from the combined time series of the modes. These quantities are plotted against the central date of the considered subseries and the x-axis error bars show the range of dates taken for each subseries. Periods of low (pink) and high (brown) magnetic activity are reported from Table 2 and ![]() is reported in red, in the bottom panel, for comparison.
is reported in red, in the bottom panel, for comparison.
Current usage metrics show cumulative count of Article Views (full-text article views including HTML views, PDF and ePub downloads, according to the available data) and Abstracts Views on Vision4Press platform.
Data correspond to usage on the plateform after 2015. The current usage metrics is available 48-96 hours after online publication and is updated daily on week days.
Initial download of the metrics may take a while.