Fig. 4
Download original image
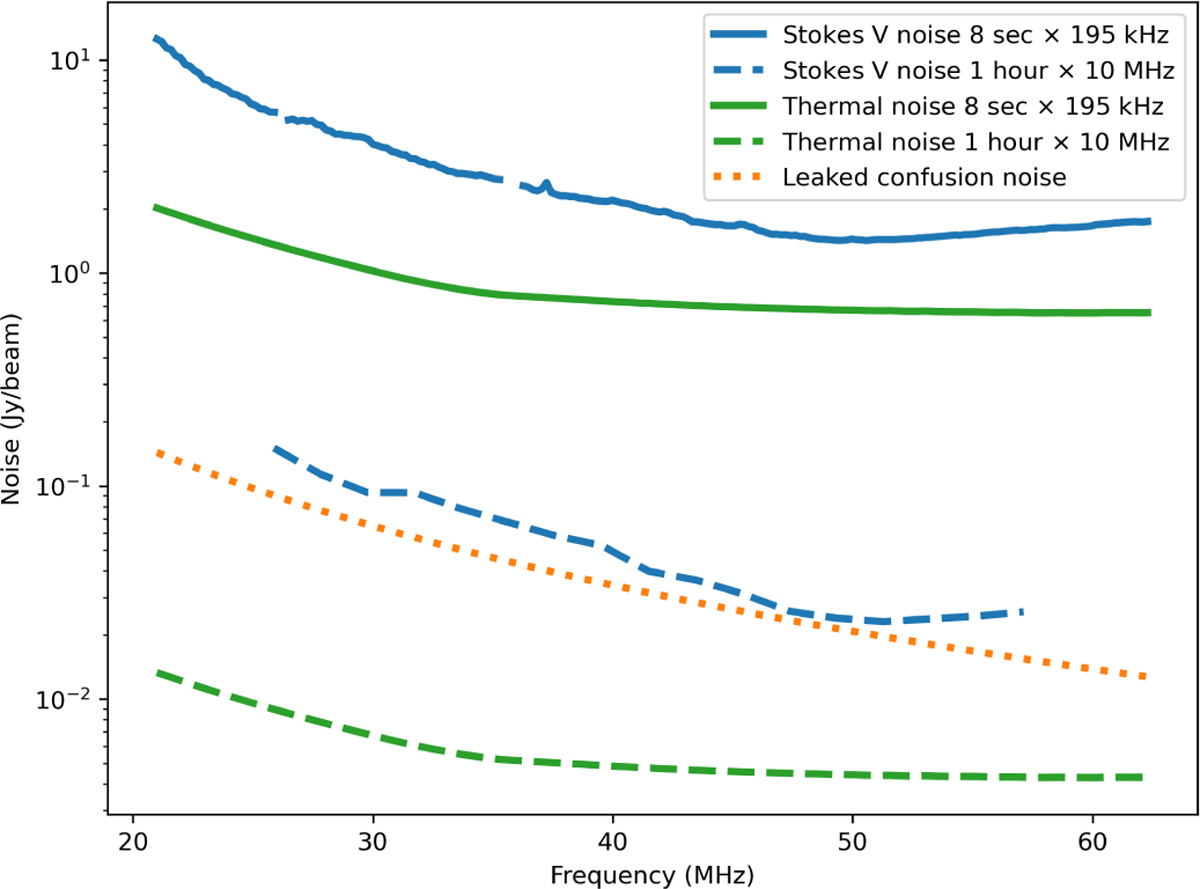
Noise levels in the Stokes V data as achieved by the pipeline. The blue lines represent the measured noise levels from the observational data for two time-frequency integrations (8 s × 195 kHz and 1 hour × 10 MHz), derived from both dynamic spectra and images. The green lines indicate the theoretical thermal noise of NenuFAR for the same time-frequency integrations. The orange line represents the estimated confusion noise in Stokes V, caused by the 0.75% leakage from Stokes I.
Current usage metrics show cumulative count of Article Views (full-text article views including HTML views, PDF and ePub downloads, according to the available data) and Abstracts Views on Vision4Press platform.
Data correspond to usage on the plateform after 2015. The current usage metrics is available 48-96 hours after online publication and is updated daily on week days.
Initial download of the metrics may take a while.