Fig. 5
Download original image
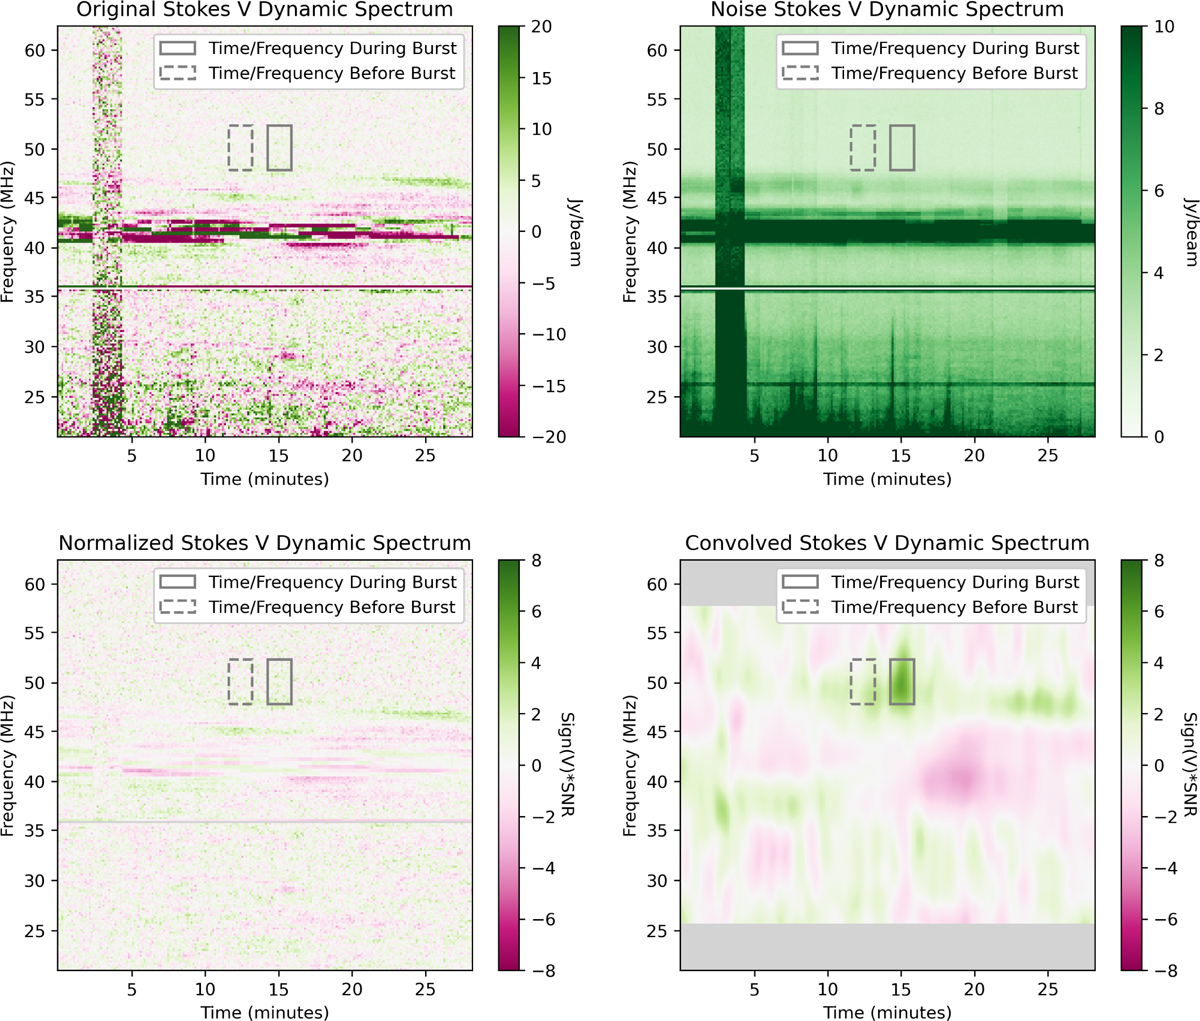
Dynamic spectra of the HD 189733 field, showing the detection of a burst after convolution. Top-left panel: original Stokes V dynamic spectrum of HD 189733, at a resolution of 8 s × 195 kHz. The frequency range 41–43 MHz and the time range of 2–5 min are affected by RFI or temporary instrumental issues. The solid grey box marks the time-frequency region of the detected burst, though it is not visible at the native resolution. A dashed grey box, located at the same frequencies but earlier in time, serves as a control region for comparison. Top-right panel: noise dynamic spectrum, showing the standard deviation computed from ~400 off-beam directions for each time-frequency pixel. RFI-contaminated regions appear with elevated noise. Bottom-left panel: normalized Stokes V dynamic spectrum after applying noise standardization. This process flattens the noise level across the spectrum and down-weights contaminated regions. Bottom-right panel: convolved Stokes V dynamic spectrum with a resolution of 40 s × 4 MHz. The burst becomes clearly visible in the solid grey box, while no signal is seen in the control region (dashed grey box). Edge frequencies are excluded due to insufficient convolutional data.
Current usage metrics show cumulative count of Article Views (full-text article views including HTML views, PDF and ePub downloads, according to the available data) and Abstracts Views on Vision4Press platform.
Data correspond to usage on the plateform after 2015. The current usage metrics is available 48-96 hours after online publication and is updated daily on week days.
Initial download of the metrics may take a while.