Fig. 6
Download original image
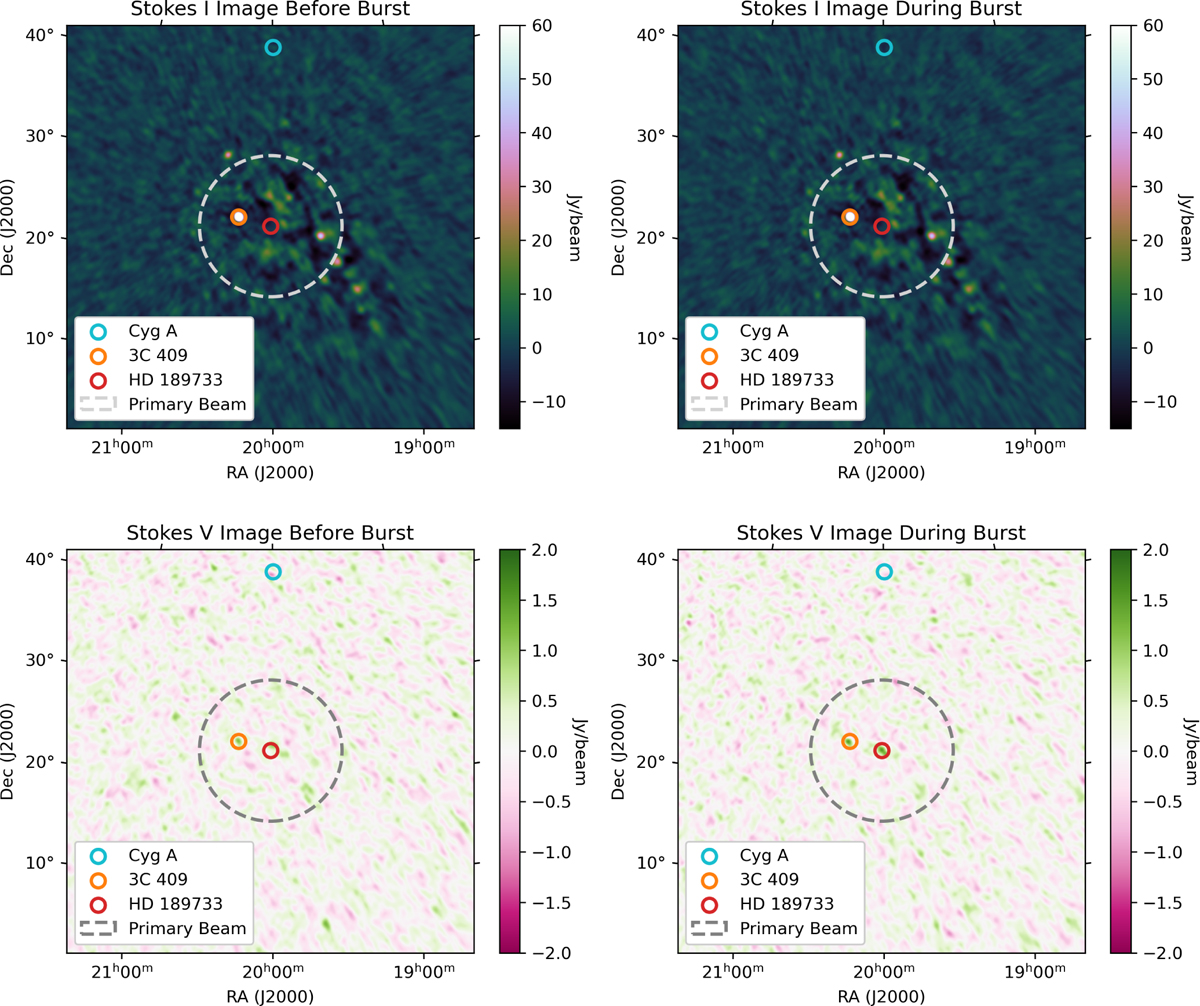
Imaging verification of a 6σ burst in the direction of HD 189733 with NenuFAR. All the panels show apparent flux images to ensure consistent noise levels beyond the primary beam. Top-left panel: Stokes I image of the FoV before the burst, generated from visibilities corresponding to the control time-frequency range (dashed grey boxes) in dynamic spectra. The orange circle marks the 200 Jy radio source 3C 409, while the red circle marks the location of HD 189733. The cyan circle marks the location of Cyg A, which was subtracted from the visibilities. The large dashed grey circle represents the primary beam area of NenuFAR at 50 MHz (the central frequency of the detection). Top-right panel: Stokes I image corresponding to the burst’s time-frequency range (as indicated by the solid grey boxes in the dynamic spectra). Due to the relatively high noise level in Stokes I, no significant emission is detected at the location of HD 189733, while the bright source 3C 409 is clearly visible. Bottom-left panel: Stokes V image of the FoV generated from the control time-frequency range. The orange circle indicates the leakage at the location of 3C 409, while no significant emission is detected at the position of HD 189733 (red circle). Bottom-right panel: Stokes V image corresponding to bursting time-frequency range. The leakage at the location of 3C 409 is still visible (orange circle) and the red circle highlights a burst detected at the location of HD 189733.
Current usage metrics show cumulative count of Article Views (full-text article views including HTML views, PDF and ePub downloads, according to the available data) and Abstracts Views on Vision4Press platform.
Data correspond to usage on the plateform after 2015. The current usage metrics is available 48-96 hours after online publication and is updated daily on week days.
Initial download of the metrics may take a while.