Fig. 7
Download original image
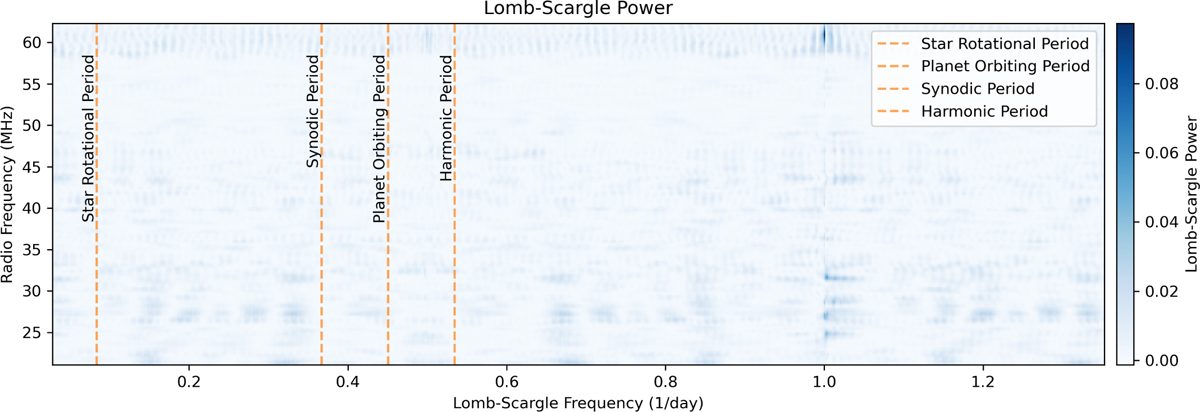
Lomb–Scargle power distribution as a function of period (represented by the Lomb–Scargle frequency on the x-axis) and radio frequency (y-axis), based on the Stokes V dynamic spectra at the highest time-frequency resolution (8 s × 195 kHz). Orange dashed lines mark periods of scientific interest: the stellar rotation period, the orbital period of the planet, and the synodic period and the harmonic period between the two. The peaks near 1 cycle/day are likely caused by observational windowing. Only peaks with a low false alarm probability (FAP < 0.01) are considered significant.
Current usage metrics show cumulative count of Article Views (full-text article views including HTML views, PDF and ePub downloads, according to the available data) and Abstracts Views on Vision4Press platform.
Data correspond to usage on the plateform after 2015. The current usage metrics is available 48-96 hours after online publication and is updated daily on week days.
Initial download of the metrics may take a while.