Fig. 1.
Download original image
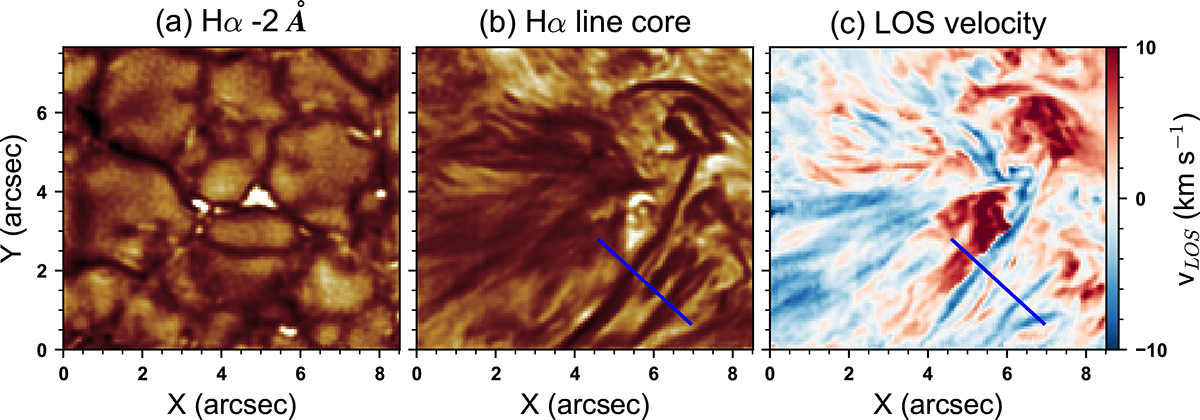
Images of a quiet-Sun region taken by the MiHI prototype at t = 8 minutes on 2018 August 25. (a): Hα–2 Å image. (b): Hα line core intensity map. (c): Hα Doppler velocity map. The solid blue lines in the Hα line core intensity map (panel (b)) and Doppler velocity map (panel (c)) indicate the artificial slits we used to construct time-distance plots in Fig. 2.
Current usage metrics show cumulative count of Article Views (full-text article views including HTML views, PDF and ePub downloads, according to the available data) and Abstracts Views on Vision4Press platform.
Data correspond to usage on the plateform after 2015. The current usage metrics is available 48-96 hours after online publication and is updated daily on week days.
Initial download of the metrics may take a while.