| Issue |
A&A
Volume 700, August 2025
|
|
|---|---|---|
| Article Number | A133 | |
| Number of page(s) | 6 | |
| Section | The Sun and the Heliosphere | |
| DOI | https://doi.org/10.1051/0004-6361/202555266 | |
| Published online | 13 August 2025 | |
Elliptically polarized transverse magnetohydrodynamic waves in quiet-region thread-like structures observed using the MiHI prototype
1
Research Institute of Natural Sciences, Chungnam National University, 99 Daehak-ro, Yuseong-gu, Daejeon 34134, Republic of Korea
2
Korea Astronomy and Space Science Institute, 776 Daedeok-daero, Yuseong-gu, Daejeon 34055, Republic of Korea
3
Astronomy Program, Department of Physics and Astronomy, Seoul National University, 1 Gwanak-ro, Gwanak-gu, Seoul 08826, Republic of Korea
4
Astronomy Research Center, Seoul National University, Gwanak-gu, Seoul 08826, Republic of Korea
5
Max-Planck Institute for Solar System Research, Justus-von-Liebig-Weg 3, 37077 Göttingen, Germany
6
Space Research and Technology Institute, Bulgarian Academy of Sciences, Acad. G. Bonchev Str., Bl. 1, 1113 Sofia, Bulgaria
7
Department of Astronomy and Space Science, Chungnam National University, 99 Daehak-ro, Yuseong-gu, Daejeon 34134, Republic of Korea
⋆ Corresponding author: This email address is being protected from spambots. You need JavaScript enabled to view it.
Received:
23
April
2025
Accepted:
5
July
2025
Abstract
Transverse magnetohydrodynamic (MHD) waves are often observed in the solar chromosphere with two different methods, the imaging method and the spectroscopic method. The velocity amplitudes of line-of-sight (LOS) oscillations inferred from the spectroscopic method, however, are usually found to be much smaller than those of plane-of-sky (POS) oscillations inferred from the imaging method. In order to understand the nature of this discrepancy, we compared these two types of oscillations by applying both methods to the same features. Using the Microlensed Hyperspectral Imager (MiHI) prototype, which provides data with an unprecedentedly high spatial, spectral, and temporal resolution and enables simultaneous acquisition of images and spectra, we detected transverse waves in thread-like structures seen in a quiet-Sun region. To investigate the nature of these oscillations, we analyzed three distinct events. Our analysis revealed that the structures oscillate both in the POS and the LOS directions, with periods of about 2.3 minutes. Notably, the velocity amplitudes measured by the spectroscopic method tend to be smaller than those measured by the imaging method, with differences of up to a factor of 2.3. Moreover, the phase differences between the two types of velocity oscillations vary significantly, with values of 209°, –75°, and 84° for events 1, 2, and 3, respectively. These findings indicate that the transverse MHD waves are elliptically polarized, and that larger amplitude oscillations occur in the POS direction. Our simultaneous detection of transverse MHD waves in two directions suggests the possibility of additional energy transport that may previously have been overlooked.
Key words: magnetohydrodynamics (MHD) / waves / methods: observational / techniques: imaging spectroscopy / Sun: atmosphere / Sun: chromosphere
© The Authors 2025
 Open Access article, published by EDP Sciences, under the terms of the Creative Commons Attribution License (https://creativecommons.org/licenses/by/4.0), which permits unrestricted use, distribution, and reproduction in any medium, provided the original work is properly cited.
This article is published in open access under the Subscribe to Open model. This email address is being protected from spambots. You need JavaScript enabled to view it. to support open access publication.
1. Introduction
The solar chromosphere is abundant with thread-like structures that support various magnetohydrodynamic (MHD) waves (e.g., Tsiropoula et al. 2012). Although the exact mechanism of coronal heating remains unclear, the MHD waves that propagate along these structures may play a crucial role in transporting energy to the upper solar atmosphere (e.g., Jess et al. 2015). Among the different types of MHD waves, transverse MHD waves are considered potential candidates for energy transport in the solar atmosphere because they are incompressible or weakly compressible, which minimizes energy dissipation in the lower atmospheric layers and enables an efficient transfer to the upper atmosphere (Morton et al. 2023). These waves are particularly prominent and easily detectable. They are often identified through the periodic swaying motions of thread-like structures. Numerous studies using high-resolution imaging and spectroscopic data have confirmed the presence of transverse MHD waves in a variety of chromospheric thread-like structures, including spicules (De Pontieu et al. 2007), mottles (Kuridze et al. 2012, 2013), and fibrils (Chae et al. 2022; Kwak et al. 2023). For details on the wave properties, we refer to Jafarzadeh et al. (2017, and references therein).
There are two primary methods for detecting transverse MHD waves in chromospheric thread-like structures: imaging and spectroscopic. The imaging method measures the transverse displacements of the thread-like structures using imaging data, with the displacements measured in the direction perpendicular to their axis in the plane of sky (POS) (e.g., Pietarila et al. 2011). On the other hand, the spectroscopic method measures the line-of-sight (LOS) Doppler velocities of these structures using spectroscopic data (Chae et al. 2021, 2022). Most studies so far have employed the imaging method, and the spectroscopic method has been used less frequently because spectroscopic data suitable for this analysis are limited. Recently, Kwak et al. (2023) statistically investigated transverse MHD waves in quiet-Sun fibrils using the spectroscopic method and demonstrated through a quantitative comparison with other imaging-based studies that the velocity amplitudes measured by the spectroscopic method tend to be smaller than those obtained by the imaging method. Specifically, the mean velocity amplitude reported by Kwak et al. (2023) is 2.03 km s−1, which is significantly smaller than the values reported in imaging-based studies. Using imaging data, Mooroogen et al. (2017) investigated internetwork chromospheric fibrils and reported a mean velocity amplitude of 4.22 km s−1. Kuridze et al. (2012) studied quiet-Sun mottles in Hα images and found a median value of 8 km s−1. Nevertheless, since these values were acquired from different instruments and datasets, a simultaneous detection in both imaging and spectroscopic data is necessary to confirm that the transverse waves identified through the spectroscopic method correspond to those observed with the imaging method.
Studies that simultaneously employ both methods on the same dataset are rare, however. Only recently, Bate et al. (2024) applied both methods to a single superpenumbral fibril to investigate two velocity components of transverse waves within it. They found a significant velocity amplitude difference between the two mutually perpendicular components, with one being approximately five times larger than the other. Since this finding was based on a single case, further studies covering a larger sample across different solar regions are needed.
In this paper, we report the detection of transverse MHD waves in both the POS and LOS directions within quiet-Sun thread-like structures. Our primary objective is to reveal the relation between the POS and LOS oscillations by detecting them simultaneously and analyzing their properties. To achieve this, we used data with an unprecedentedly high resolution in the spatial, spectral, and temporal domains, obtained by a prototype of the Microlensed Hyperspectral Imager (MiHI; van Noort et al. 2022) at the Swedish 1-m Solar Telescope (SST; Scharmer et al. 2003), which is capable of obtaining images and spectra simultaneously.
2. Data and analysis
We analyzed Hα spectral data obtained on 2018 August 25. The MiHI prototype is a microlens-based integral field spectrograph that provides data with a high spatial, spectral, and temporal resolution. The size of the field of view is 9.2″ × 8.2″ with a spatial sampling of 0 066. The wavelength range spans 4.5 Å with a spectral sampling of 0.01 Å. The observation was conducted in a quiet-Sun region near the solar disk center for about 17 minutes, from 09:07:48 to 09:25:05 UT (hereafter, the time 09:07:48 UT is referred to as t = 0), with a cadence of 1.33 s. The data reduction and image restoration methods for the MiHI prototype were described by van Noort & Doerr (2022).
Figure 1 shows the observed region using the MiHI prototype. In the Hα–2 Å image, granules and several photospheric bright points are observed. These bright points are associated with magnetic field concentrations (Chitta et al. 2024). Numerous thread-like structures are present in the Hα line core image. The same data were also used by Chae et al. (2024) to study large-amplitude transverse oscillations prevalent in the nonspicular chromosphere of the quiet Sun. They also analyzed extreme-ultraviolet images and magnetogram data and concluded that the observed region was very quiet during the MiHI observation, representing a typical quiet region on the Sun.
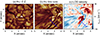 |
Fig. 1. Images of a quiet-Sun region taken by the MiHI prototype at t = 8 minutes on 2018 August 25. (a): Hα–2 Å image. (b): Hα line core intensity map. (c): Hα Doppler velocity map. The solid blue lines in the Hα line core intensity map (panel (b)) and Doppler velocity map (panel (c)) indicate the artificial slits we used to construct time-distance plots in Fig. 2. |
The Hα line core intensity and the Doppler velocity were derived using the lambdameter method (Deubner et al. 1996). We set the lambdameter width to 0.5 Å and determined the midpoint of the corresponding chord. The intensity and Doppler velocity at each point in the image were then obtained, as shown in Figs. 1(b) and (c). To trace the transverse motion of the thread-like structures, we placed an artificial slit (blue line) perpendicular to these structures and constructed time-distance plots of the intensity and velocity, as shown in Fig. 2.
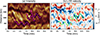 |
Fig. 2. Time-distance plots of the Hα line core intensity (a) and LOS velocity (b) constructed along the artificial slits represented by the solid blue lines in Fig. 1. The three dashed magenta lines correspond to displacements of the transverse oscillations of the thread-like structures in the time-distance intensity plot. The events are numbered according to the order of occurrence. The dashed light green lines in the time-distance plot of the LOS velocity represent the same points. |
3. Results
We identified transverse oscillatory motions in the thread-like structures, as previously demonstrated by Chae et al. (2024) using the same dataset. Figure 2 presents time-distance plots of the intensity and the LOS velocity. These transverse motions are generally evident in the time-distance intensity plot. The transverse displacements of the thread-like structures indicate oscillations that occur perpendicular to their axes, which can be observed in the imaging data in the POS. We refer to these as transverse oscillatory motions in the POS direction. In the time-distance intensity plot (Fig. 2(a)), we identified three distinct POS oscillation events (dashed magenta lines), all of which overlap a subset of the transverse motions analyzed by Chae et al. (2024). Although numerous other POS oscillations are present, we selected these three events for analysis because they are clearly visible and span more than one oscillation period, which is an essential condition for uncovering their relations with the corresponding LOS oscillations. To trace each oscillatory motion in the time-distance plot, we manually selected points along the dark oscillatory feature and interpolated them at uniform time intervals. We then applied a sine fitting to the interpolated points, considering a linear trend as well. We ultimately obtained the trajectory of the oscillations. The sine curve, which represents the transverse displacements, is defined by the expression
 (1)
(1)
where A is the amplitude, P is the period, and b and c represent the linear trend. The linear trends were removed for the three events, and the detrended transverse displacements were converted into velocity. The results are presented in Fig. 3 with solid magenta lines. From the sine fitting applied to the temporal variations of the POS velocity, we determined oscillation properties such as the period and velocity amplitude, and we summarize them in Table 1.
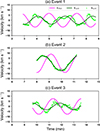 |
Fig. 3. Time series of the velocity oscillations for the three events. The time domains vary for each event because their occurrence times are different. The solid magenta lines represent velocity oscillations in the POS direction, and the light green dots indicate velocity oscillations in the LOS direction. The solid dark green lines show the sine fitting results applied to the LOS velocity oscillations. |
Transverse oscillation properties of thread-like structures in the POS and LOS directions.
Additionally, we found that transverse oscillatory motions are also prominent in the LOS direction. To confirm the LOS oscillatory motions in the thread-like structures, we analyzed the Doppler velocity at the same positions obtained from the sine fitting in the time-distance intensity plot (see Fig. 2(b)). The LOS velocity traced by the dashed light green lines appears to be part of the overall velocity oscillations. It is important to note that these patterns come from thread-like structures that were identified based on the intensity data. The time-distance plot of the LOS velocity suggests that the oscillations may not be confined to the thread-like structures. We cannot exclude the possibility that the thread-like structures and the surrounding medium both oscillate. The temporal variations in the LOS velocity for the three events are shown as light green circles in Fig. 3. For event 2, the LOS velocity oscillations exhibit a single period, whereas for events 1 and 3, they appear to be a superposition of multiple oscillation components, including both shorter- and longer-period oscillations. The presence of multiple period components is commonly observed in thread-like structures (e.g., Bate et al. 2024; Lee et al. 2025), as waves originating from different sources and different modes can be superposed in the LOS direction. Additionally, this superposition may result from the overlapping transverse waves that occur in multiple optically thin structures. Despite this complexity, we applied a sine fitting to the LOS velocity variations using the same method as for the POS velocity oscillations. The fitting results, shown as solid dark green lines in Fig. 3, demonstrate a close relation between the LOS oscillations (solid dark green lines) and the POS oscillations (solid magenta lines), but with slight phase differences. The corresponding oscillation properties, including phase differences between the POS and LOS oscillations, are summarized in Table 1.
We confirmed the presence of velocity oscillations in the POS and LOS directions and conducted a quantitative comparison of their wave properties. Table 1 summarizes the wave properties, including the period, velocity amplitude, and phase difference, for the three events in the POS and LOS directions. The wave periods in both directions are very similar. For events 1 and 3, the periods are nearly identical at 2.3 minutes in the POS direction and 2.2 minutes in the LOS direction. For event 2, the periods differ slightly, with 2.3 minutes in the POS direction and 2.8 minutes in the LOS direction.
The velocity amplitudes show a notable difference, however, with those in the POS direction consistently larger than those in the LOS direction in all events. Additionally, phase differences exist between the velocity time series in the POS and LOS directions, calculated relative to the POS direction. For event 1, the velocity amplitudes are 6.7 km s−1 in the POS direction and 4 km s−1 in the LOS direction. The phase difference between the two oscillations is 209°. For event 2, the velocity amplitudes are 9 km s−1 in the POS direction and 7.3 km s−1 in the LOS direction, with a phase difference of –75°. For event 3, the velocity amplitudes are 7.7 km s−1 in the POS direction and 3.3 km s−1 in the LOS direction, with a phase difference of 84°.
The trajectories, obtained by combining the POS and LOS displacements, suggest elliptically polarized transverse MHD waves. Figure 4 displays the trajectories of the three events over time. Two perpendicular transverse waves that oscillate with similar periods but a phase difference result in polarized waves. A phase difference of 0 or ±π leads to linear polarization, whereas a phase difference of ±π/2 leads to circular polarization. Any other phase difference produces elliptical polarization. Our analysis yields phase differences of 209°, –75°, and 84° for events 1, 2, and 3, respectively. This confirms that the waves are elliptically polarized. Moreover, the larger velocity amplitudes in the POS direction also contribute to the elliptical shape of the trajectories. In event 3, where the phase difference is 84°, the trajectory would be expected to be nearly circular. The velocity amplitudes in the POS direction are larger, however, and so it distinctly exhibits an elliptical shape.
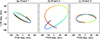 |
Fig. 4. Trajectories of transverse oscillatory displacements in the POS and LOS directions for the three events. The colors indicate the temporal evolution with a transition from red to blue. |
4. Summary and discussion
We investigated the motion of chromospheric thread-like structures in two different directions, namely, the POS and LOS directions, and focused on three specific events for an in-depth analysis. In all three events, the wave periods in both directions are very similar, around 2.3 minutes. Moreover, the time series of the POS and LOS velocity oscillations show that they are closely related (see Fig. 3). The velocity amplitudes in the POS direction are larger than those in the LOS direction, however. They differ by up to a factor of 2.3. Additionally, there are phase differences between the two velocity oscillations, which vary widely: 209°, –75°, and 84° for events 1, 2, and 3, respectively. These findings indicate a strong correlation between the transverse oscillatory motions in the POS and LOS directions, which supports a coherent wave behavior in the thread-like structures. Ultimately, our results suggest that the observed transverse oscillations are elliptically polarized kink waves, with larger amplitude oscillations occurring in the POS direction.
Together with previous studies, our results suggest that elliptically polarized kink waves are quite common in the chromosphere. Previously, Stangalini et al. (2017) examined the horizontal motions of small-scale magnetic elements in chromospheric Ca II H broadband images by tracking their movements and reported that these motions indicate the presence of elliptically polarized kink waves. Although the detection method differs significantly from the tracking approach, the simultaneous detection of transverse MHD waves in two directions provides a means to reveal the nature of these waves as elliptically polarized kink waves. Using this method, Bate et al. (2024) detected elliptically polarized kink waves in a single chromospheric fibril within a sunspot region. Petrova et al. (2025) reported the detection of elliptically polarized transverse waves with a period of 15s in a chromospheric fibril within an active region. In addition, Kianfar et al. (2025) identified various types of polarized transverse waves in Ca II K bright fibrils in the chromosphere. We also independently confirmed the existence of elliptically polarized kink waves in the chromospheric thread-like structures in the quiet Sun. While simultaneous detection studies are essential for understanding the physical properties and nature of transverse waves in the chromosphere, observational limitations and the lack of high-quality data that enable these studies have resulted in only a few studies to date. In the present study, we examined three events with excellent spatial, spectral, and temporal resolution, enabling the simultaneous acquisition of images and spectra. Further studies across various regions, such as plages, pores, and others are needed, however, to draw more general conclusions about transverse waves in the chromosphere and their role in the energy transport to the higher atmosphere.
The velocity amplitudes measured simultaneously in two directions on the same structures show a notable discrepancy. In all three events, the velocity amplitudes in the POS direction are larger than those in the LOS direction, with POS-to-LOS velocity amplitude ratios of 1.7, 1.2, and 2.3 for events 1, 2, and 3, respectively. A similar phenomenon was also reported in a superpenumbral fibril, with an amplitude ratio of 5.3 (Bate et al. 2024), indicating a more significant discrepancy in a sunspot region. Since Bate et al. (2024) applied additional corrections for projection effects to the POS and LOS oscillations, a direct comparison with our results is not straightforward. In our study, however, the projection effects of the thread-like structures do not need to be considered since the region of interest is located near the disk center and the structures are sufficiently horizontal. Nevertheless, the discrepancy between the two velocity amplitudes is evident.
This discrepancy was previously anticipated through the spectroscopic detection of transverse MHD waves. Kwak et al. (2023) investigated the properties of transverse MHD waves in quiet-Sun fibrils and found that the measured LOS velocity amplitudes are smaller than those reported in previous imaging-based studies (Kuridze et al. 2012; Mooroogen et al. 2017), with values lower than half of those obtained using the imaging method. Interestingly, this agrees with the results of the present study, which show POS-to-LOS velocity amplitude ratios of approximately two.
The question now is why the velocity amplitudes observed in the LOS direction are smaller than those in the POS direction. One possible explanation is that the LOS velocity amplitudes have been systematically underestimated. If the thread-like structures are not optically thick enough, both the supposedly stationary underlying atmosphere and the structures themselves may contribute to the formation of the Hα absorption core. As a consequence, the measured Doppler velocities may be quite underestimated. In the extreme case of optically very thin structures, the Doppler velocity would be mostly determined by the underlying atmosphere and not by the structures of our interest. This is not such an extreme case, however, as the structures appear sufficiently dark, suggesting they may not be optically thin. Therefore, it remains a possibility that the LOS velocity amplitudes are intrinsically smaller than the POS velocity amplitudes. If this is so, the physical reason for this difference remains to be understood.
We suggest that the lower LOS velocity amplitudes may be attributed to the suppressing effect of vertical stratification of plasma pressure and magnetic fields on vertical oscillations. In the Hα chromosphere with low plasma beta, magnetic field stratification may play a more significant role than plasma pressure stratification. If this is the case, the suppression of vertical velocity will be more pronounced in stronger field regions. In fact, this seems to be what has been observed. In this study, the LOS velocity amplitudes measured in the quiet-Sun region are 4.0, 7.3, and 3.3 km s−1 for events 1, 2, and 3, respectively. These values are significantly higher than those observed in regions with stronger magnetic fields. In the network region, which likely has stronger magnetic fields than the quiet-Sun region examined in this study, the reported mean LOS velocity amplitude is 1.33 km s−1 (Kwak et al. 2023). In sunspot regions, where the magnetic fields are known to be even stronger, the mean reported LOS velocity amplitudes are 0.6 km s−1 in Chae et al. (2022) and 0.7 km s−1 in Lee et al. (2025), while Bate et al. (2024) reported a single LOS velocity amplitude of 0.3 km s−1. Kwak et al. (2023) found an inverse relation between the magnetic field strengths and velocity amplitudes, with a proportional factor of 0.6. In other words, the ratio of the velocity amplitudes in two different regions can provide a rough estimate of the ratio of their magnetic field strengths. For instance, the velocity amplitude measured for event 1 is 4 km s−1, while in a sunspot region, Chae et al. (2022) reported a value of 0.6 km s−1. Based on this relation, the estimated ratio of the magnetic field strengths between these two regions is approximately 10. Because Chae et al. (2022) adopted a magnetic field strength of 150 G for the sunspot region at the chromospheric height, a value of around 15 G in the quiet Sun appears to be a reasonable estimate. This is comparable to the 10 G estimated by Chae et al. (2024) through potential field extrapolation. Further studies with more data from various regions are needed to confirm this relation, however.
An important implication of our results is that the transverse wave energy flux may be significantly underestimated if it is estimated from velocity amplitudes measured in only one direction. This is obvious because the energy flux of transverse waves propagating into a horizontal direction is given by
 (2)
(2)
where ρ is the mass density, c is the propagation velocity, and vPOS and vLOS are the velocity amplitudes in the POS and LOS directions, respectively. This result suggests that detecting elliptically polarized kink waves in both directions may reveal additional energy contributions that would otherwise be overlooked. In the special case where the velocity amplitudes in the POS and LOS directions are identical, the wave energy flux would be doubled compared to estimates based on a single direction. For event 2, which exhibits the largest velocity amplitudes, we estimated the wave energy flux to be 6.8 × 10⁵erg s−1 cm−2, using the values from Chae et al. (2024), including a mass density of 1.0 × 10⁻¹³ g cm−3 and a magnetic field strength of 10 G. This remains insufficient for chromospheric heating, however, which requires 4 × 10⁶erg s−1 cm−2 (Withbroe & Noyes 1977), as the velocity amplitudes are somewhat small. Nevertheless, our finding is significant because the measured wave energy flux can be increased by up to a factor of two when both POS and LOS velocity amplitudes are considered, compared to estimates that are solely based on the POS velocity amplitude. Moreover, it can be significantly increased by up to a factor of a few compared to estimates based on the LOS velocity amplitude alone. This conclusion holds regardless of whether the smaller LOS velocity amplitudes result from systematic measurement errors or represent an intrinsic property.
It is obvious that further studies are required to resolve the problem whether the high POS-to-LOS velocity amplitude ratios do represent an intrinsic property of the transverse waves in the chromosphere or simply reflect systematic errors in the LOS velocity measurements derived from the Hα line profiles. If the measured ratios were to turn out to be physically intrinsic, the elliptically polarized transverse waves we found would be observationally established and would await theoretical investigations into their properties and physical origin.
Acknowledgments
We are grateful to the referee for carefully reading the manuscript and for providing constructive comments. This research was supported by Basic Science Research Program through the National Research Foundation of Korea (NRF) funded by the Ministry of Education(RS-2024-00452856), and by the National Research Foundation of Korea (NRF-2022R1A2C1092602). E.-K.L. is supported by the Korea Astronomy and Space Science Institute under the R&D program of the Korean government (MSIT; No. 2025-1-850-02). J.C. was supported by the National Research Foundation of Korea (RS-2023-00208117). J.K. was supported by the National Research Foundation of Korea (RS-2023-00273679). M.M. acknowledges the support of the Brain Pool program funded by the Ministry of Science and ICT through the National Research Foundation of Korea (RS-2024-00408396) and DFG grant WI 3211/8-2, project number 452856778. The Swedish 1-m Solar Telescope is operated on the island of La Palma by the Institute for Solar Physics of Stockholm University in the Spanish Observatorio del Roque de los Muchachos of the Instituto de Astrofísica de Canarias. The Institute for Solar Physics is supported by a grant for research infrastructures of national importance from the Swedish Research Council (registration number 2021-00169)
References
- Bate, W., Jess, D. B., Grant, S. D. T., et al. 2024, ApJ, 970, 66 [NASA ADS] [CrossRef] [Google Scholar]
- Chae, J., Cho, K., Nakariakov, V. M., Cho, K.-S., & Kwon, R.-Y. 2021, ApJ, 914, L16 [NASA ADS] [CrossRef] [Google Scholar]
- Chae, J., Cho, K., Lim, E.-K., & Kang, J. 2022, ApJ, 933, 108 [CrossRef] [Google Scholar]
- Chae, J., van Noort, M., Madjarska, M. S., et al. 2024, A&A, 687, A249 [NASA ADS] [CrossRef] [EDP Sciences] [Google Scholar]
- Chitta, L. P., van Noort, M., Smitha, H. N., Priest, E. R., & Rouppe van der Voort, L. H. M. 2024, ApJ, 976, 134 [Google Scholar]
- De Pontieu, B., McIntosh, S. W., Carlsson, M., et al. 2007, Science, 318, 1574 [Google Scholar]
- Deubner, F. L., Waldschik, T., & Steffens, S. 1996, A&A, 307, 936 [Google Scholar]
- Jafarzadeh, S., Solanki, S. K., Gafeira, R., et al. 2017, ApJS, 229, 9 [Google Scholar]
- Jess, D. B., Morton, R. J., Verth, G., et al. 2015, Space Sci. Rev., 190, 103 [Google Scholar]
- Kianfar, S., Leenaarts, J., Esteban Pozuelo, S., et al. 2025, A&A, 698, A124 [NASA ADS] [CrossRef] [EDP Sciences] [Google Scholar]
- Kuridze, D., Morton, R. J., Erdélyi, R., et al. 2012, ApJ, 750, 51 [NASA ADS] [CrossRef] [Google Scholar]
- Kuridze, D., Verth, G., Mathioudakis, M., et al. 2013, ApJ, 779, 82 [NASA ADS] [CrossRef] [Google Scholar]
- Kwak, H., Chae, J., Lim, E.-K., et al. 2023, ApJ, 958, 131 [NASA ADS] [CrossRef] [Google Scholar]
- Lee, K.-S., Chae, J., Kwak, H., et al. 2025, A&A, 696, A189 [NASA ADS] [CrossRef] [EDP Sciences] [Google Scholar]
- Mooroogen, K., Morton, R. J., & Henriques, V. 2017, A&A, 607, A46 [NASA ADS] [CrossRef] [EDP Sciences] [Google Scholar]
- Morton, R. J., Sharma, R., Tajfirouze, E., & Miriyala, H. 2023, Rev. Mod. Plasma Phys., 7, 17 [NASA ADS] [CrossRef] [Google Scholar]
- Petrova, E., Van Doorsselaere, T., van Noort, M., Berghmans, D., & Castellanos Durán, J. S. 2025, A&A, 697, A168 [NASA ADS] [CrossRef] [EDP Sciences] [Google Scholar]
- Pietarila, A., Aznar Cuadrado, R., Hirzberger, J., & Solanki, S. K. 2011, ApJ, 739, 92 [NASA ADS] [CrossRef] [Google Scholar]
- Scharmer, G. B., Bjelksjo, K., Korhonen, T. K., Lindberg, B., & Petterson, B. 2003, in Innovative Telescopes and Instrumentation for Solar Astrophysics, eds. S. L. Keil, & S. V. Avakyan, Society of Photo-Optical Instrumentation Engineers (SPIE) Conference Series, 4853, 341 [NASA ADS] [CrossRef] [Google Scholar]
- Stangalini, M., Giannattasio, F., Erdélyi, R., et al. 2017, ApJ, 840, 19 [NASA ADS] [CrossRef] [Google Scholar]
- Tsiropoula, G., Tziotziou, K., Kontogiannis, I., et al. 2012, Space Sci. Rev., 169, 181 [Google Scholar]
- van Noort, M., & Doerr, H. P. 2022, A&A, 668, A151 [NASA ADS] [CrossRef] [EDP Sciences] [Google Scholar]
- van Noort, M., Bischoff, J., Kramer, A., Solanki, S. K., & Kiselman, D. 2022, A&A, 668, A149 [NASA ADS] [CrossRef] [EDP Sciences] [Google Scholar]
- Withbroe, G. L., & Noyes, R. W. 1977, ARA&A, 15, 363 [Google Scholar]
All Tables
Transverse oscillation properties of thread-like structures in the POS and LOS directions.
All Figures
|
Fig. 1. Images of a quiet-Sun region taken by the MiHI prototype at t = 8 minutes on 2018 August 25. (a): Hα–2 Å image. (b): Hα line core intensity map. (c): Hα Doppler velocity map. The solid blue lines in the Hα line core intensity map (panel (b)) and Doppler velocity map (panel (c)) indicate the artificial slits we used to construct time-distance plots in Fig. 2. |
| In the text | |
|
Fig. 2. Time-distance plots of the Hα line core intensity (a) and LOS velocity (b) constructed along the artificial slits represented by the solid blue lines in Fig. 1. The three dashed magenta lines correspond to displacements of the transverse oscillations of the thread-like structures in the time-distance intensity plot. The events are numbered according to the order of occurrence. The dashed light green lines in the time-distance plot of the LOS velocity represent the same points. |
| In the text | |
|
Fig. 3. Time series of the velocity oscillations for the three events. The time domains vary for each event because their occurrence times are different. The solid magenta lines represent velocity oscillations in the POS direction, and the light green dots indicate velocity oscillations in the LOS direction. The solid dark green lines show the sine fitting results applied to the LOS velocity oscillations. |
| In the text | |
|
Fig. 4. Trajectories of transverse oscillatory displacements in the POS and LOS directions for the three events. The colors indicate the temporal evolution with a transition from red to blue. |
| In the text | |
Current usage metrics show cumulative count of Article Views (full-text article views including HTML views, PDF and ePub downloads, according to the available data) and Abstracts Views on Vision4Press platform.
Data correspond to usage on the plateform after 2015. The current usage metrics is available 48-96 hours after online publication and is updated daily on week days.
Initial download of the metrics may take a while.