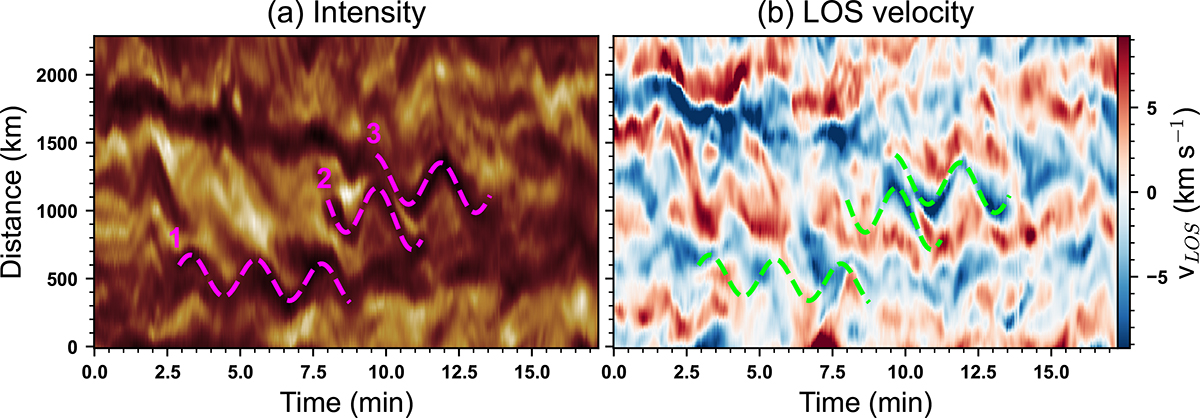
Fig. 2.
Download original image
Time-distance plots of the Hα line core intensity (a) and LOS velocity (b) constructed along the artificial slits represented by the solid blue lines in Fig. 1. The three dashed magenta lines correspond to displacements of the transverse oscillations of the thread-like structures in the time-distance intensity plot. The events are numbered according to the order of occurrence. The dashed light green lines in the time-distance plot of the LOS velocity represent the same points.
Current usage metrics show cumulative count of Article Views (full-text article views including HTML views, PDF and ePub downloads, according to the available data) and Abstracts Views on Vision4Press platform.
Data correspond to usage on the plateform after 2015. The current usage metrics is available 48-96 hours after online publication and is updated daily on week days.
Initial download of the metrics may take a while.