Fig. 3.
Download original image
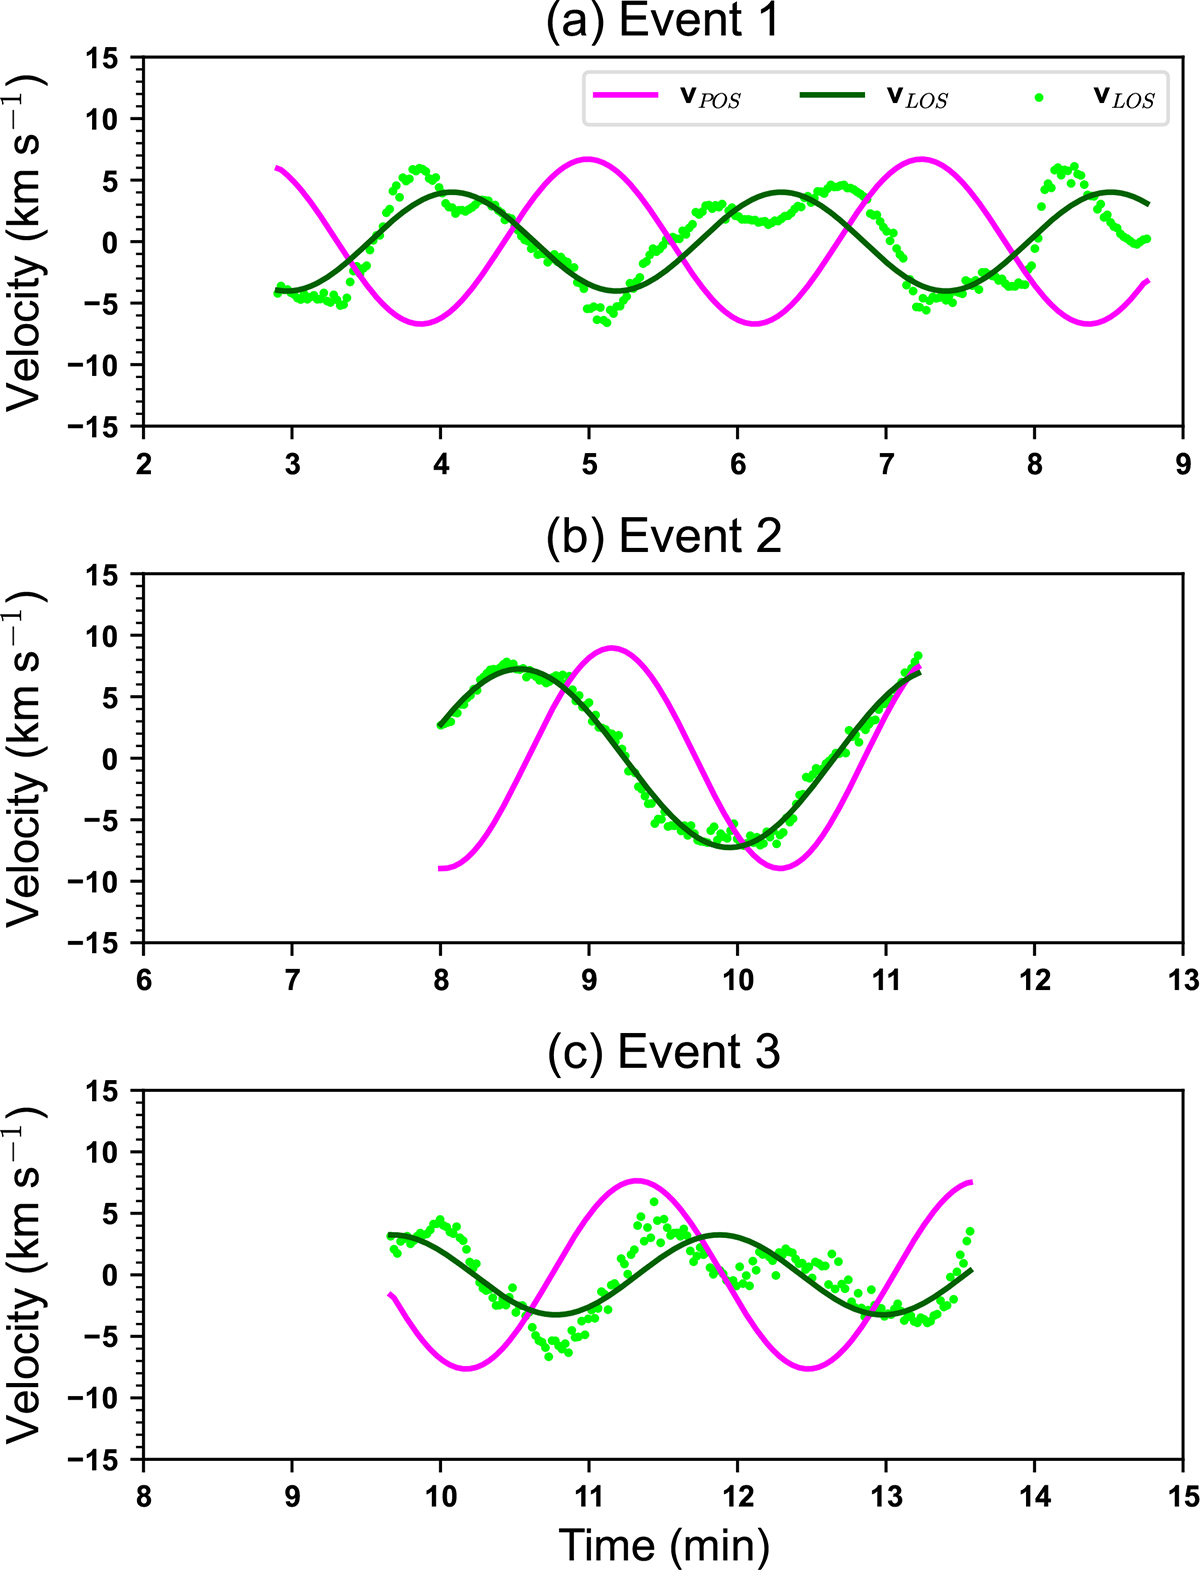
Time series of the velocity oscillations for the three events. The time domains vary for each event because their occurrence times are different. The solid magenta lines represent velocity oscillations in the POS direction, and the light green dots indicate velocity oscillations in the LOS direction. The solid dark green lines show the sine fitting results applied to the LOS velocity oscillations.
Current usage metrics show cumulative count of Article Views (full-text article views including HTML views, PDF and ePub downloads, according to the available data) and Abstracts Views on Vision4Press platform.
Data correspond to usage on the plateform after 2015. The current usage metrics is available 48-96 hours after online publication and is updated daily on week days.
Initial download of the metrics may take a while.