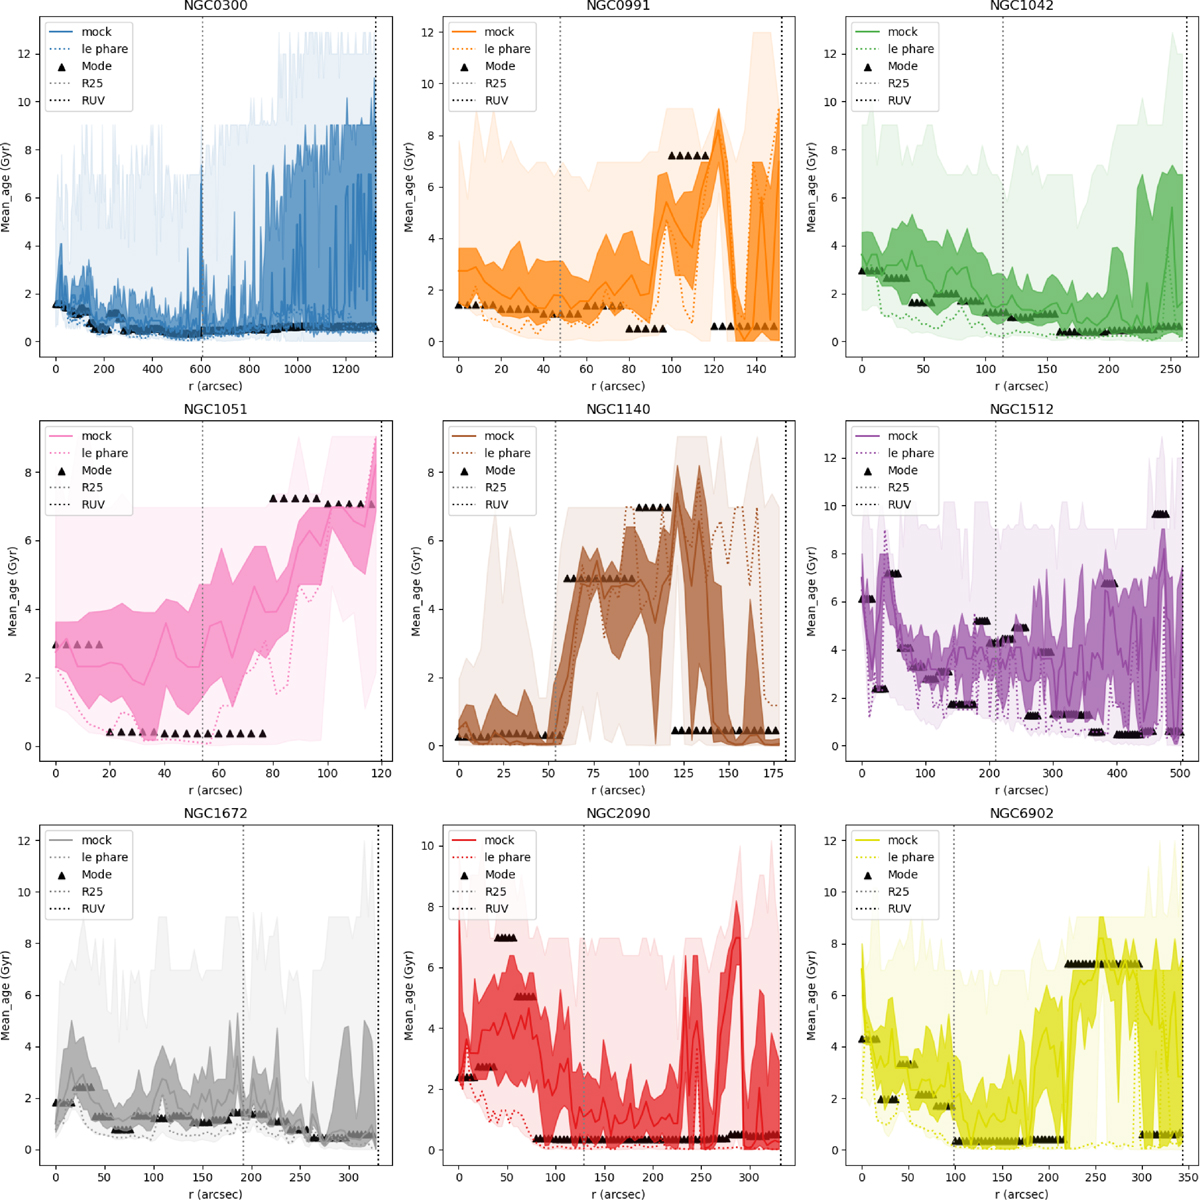
Fig. A.1.
Download original image
Mean age as a function of the radius. The dotted line is the mean age calculated with Le Phare and the continuous line is the median of the mock simulations (see section 3.4). The triangles represent the mode of the mean age of the mocks in a range of 20 arcsec. The gray dotted line is the R25 while the black one is the RUV. The shadow area is the area between the first and the third quartile of the mocks while the light area is the minimum and the maximum mean age found in the mocks.
Current usage metrics show cumulative count of Article Views (full-text article views including HTML views, PDF and ePub downloads, according to the available data) and Abstracts Views on Vision4Press platform.
Data correspond to usage on the plateform after 2015. The current usage metrics is available 48-96 hours after online publication and is updated daily on week days.
Initial download of the metrics may take a while.