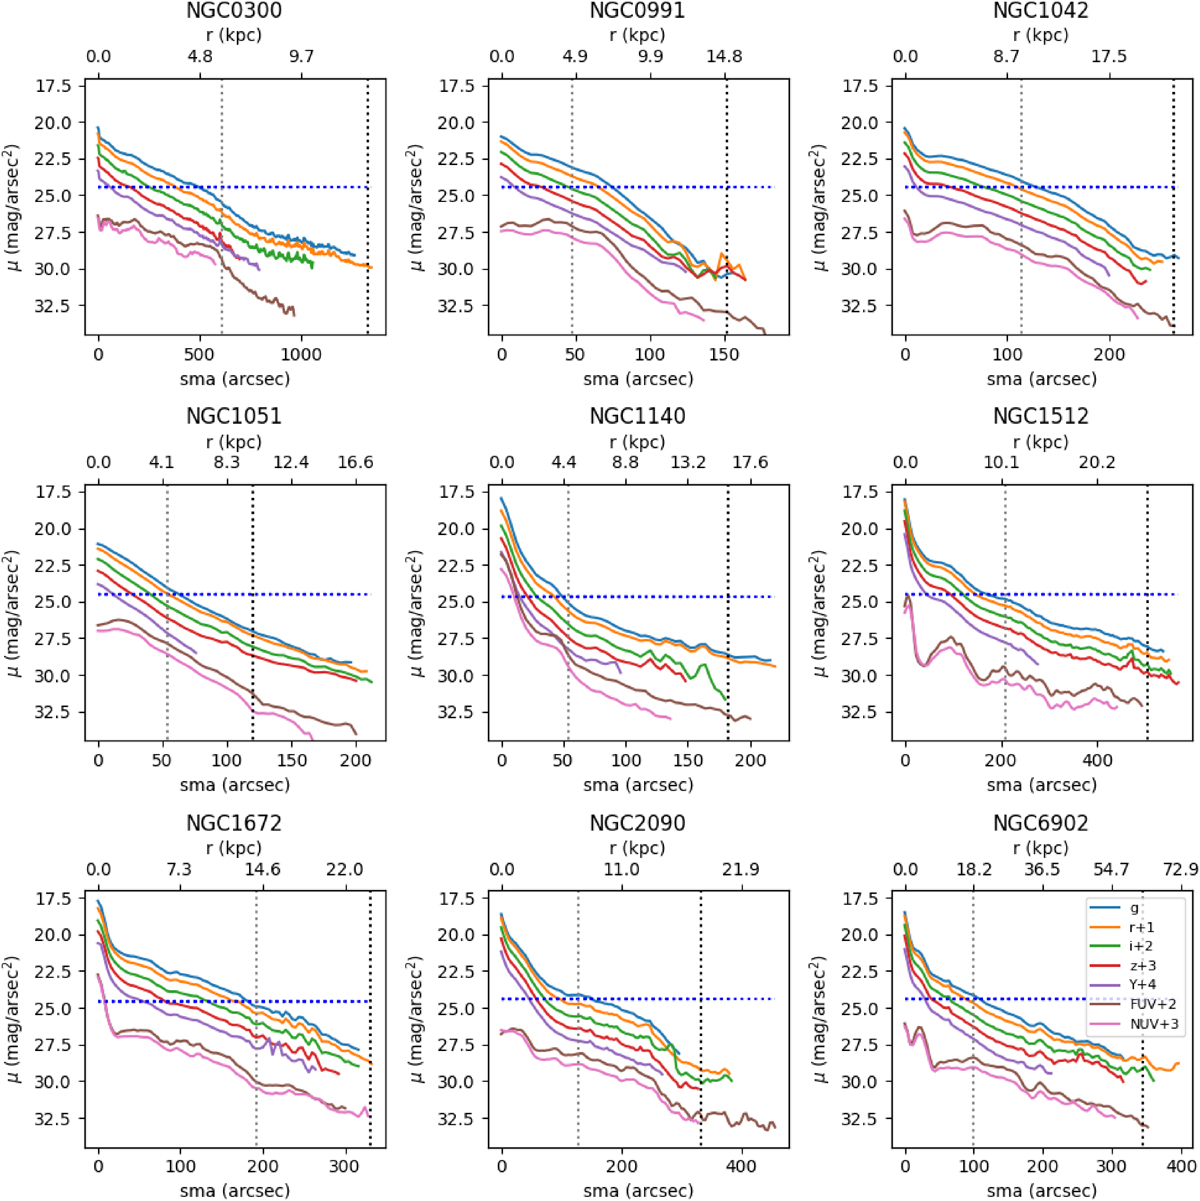
Fig. 2.
Download original image
Observed surface brightness profiles for each band of the sample as a function of the semimajor axis of the ellipses. The dashed gray line is the R25 and the dashed black line is the RUV defined in Section 3.3.1. For clarity, an offset have been applied on the profiles of +n magnitudes/arcsec2 with a dependence on the bands indicated in the bottom right panel. The dotted blue line represents 25 mag.arcsec−2 in the B band adapted to the g band using Fukugita et al. (1995).
Current usage metrics show cumulative count of Article Views (full-text article views including HTML views, PDF and ePub downloads, according to the available data) and Abstracts Views on Vision4Press platform.
Data correspond to usage on the plateform after 2015. The current usage metrics is available 48-96 hours after online publication and is updated daily on week days.
Initial download of the metrics may take a while.