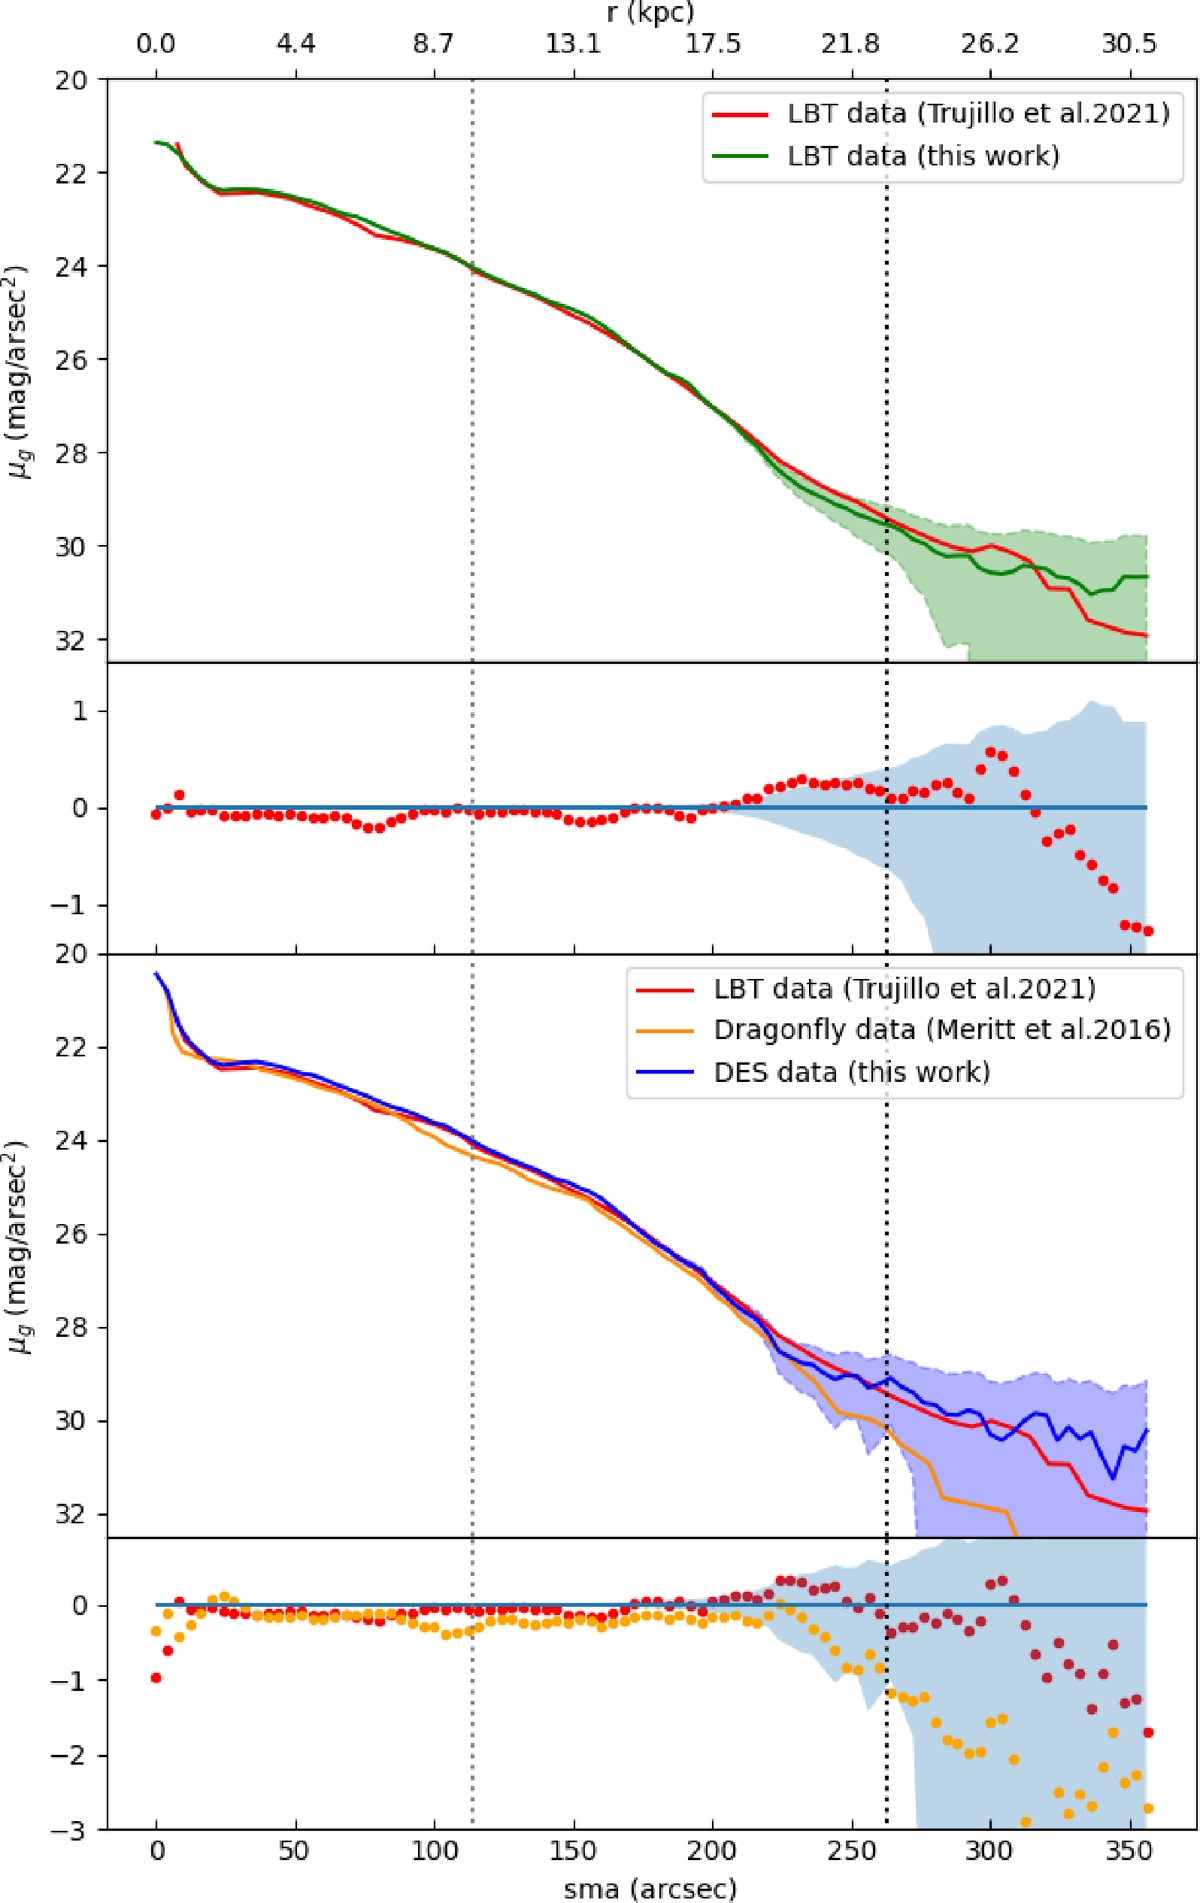
Fig. 3.
Download original image
Surface brightness profile in g band for NGC 1042 as a function of the semimajor axis (sma) of ellipses. Top: Comparison of the method with the profile from Trujillo et al. (2021) with LBT data (in red) and our method applied to the same data (in green), and the difference between them under the main panel. Bottom: Comparison of the data with the profile from Trujillo et al. (2021) with LBT data (in red), the profile from Merritt et al. (2016) with Dragonfly data, and our method applied to DES data (in blue). The differences between the other profiles and ours are shown under the main panel. The dashed gray line is the R25 of the galaxy when the dashed black line is the RUV. The shaded area shows the uncertainties for LBT data with the method used here in the top panel and DES data with the method used here in the bottom panel.
Current usage metrics show cumulative count of Article Views (full-text article views including HTML views, PDF and ePub downloads, according to the available data) and Abstracts Views on Vision4Press platform.
Data correspond to usage on the plateform after 2015. The current usage metrics is available 48-96 hours after online publication and is updated daily on week days.
Initial download of the metrics may take a while.