Open Access
Fig. 5.
Download original image
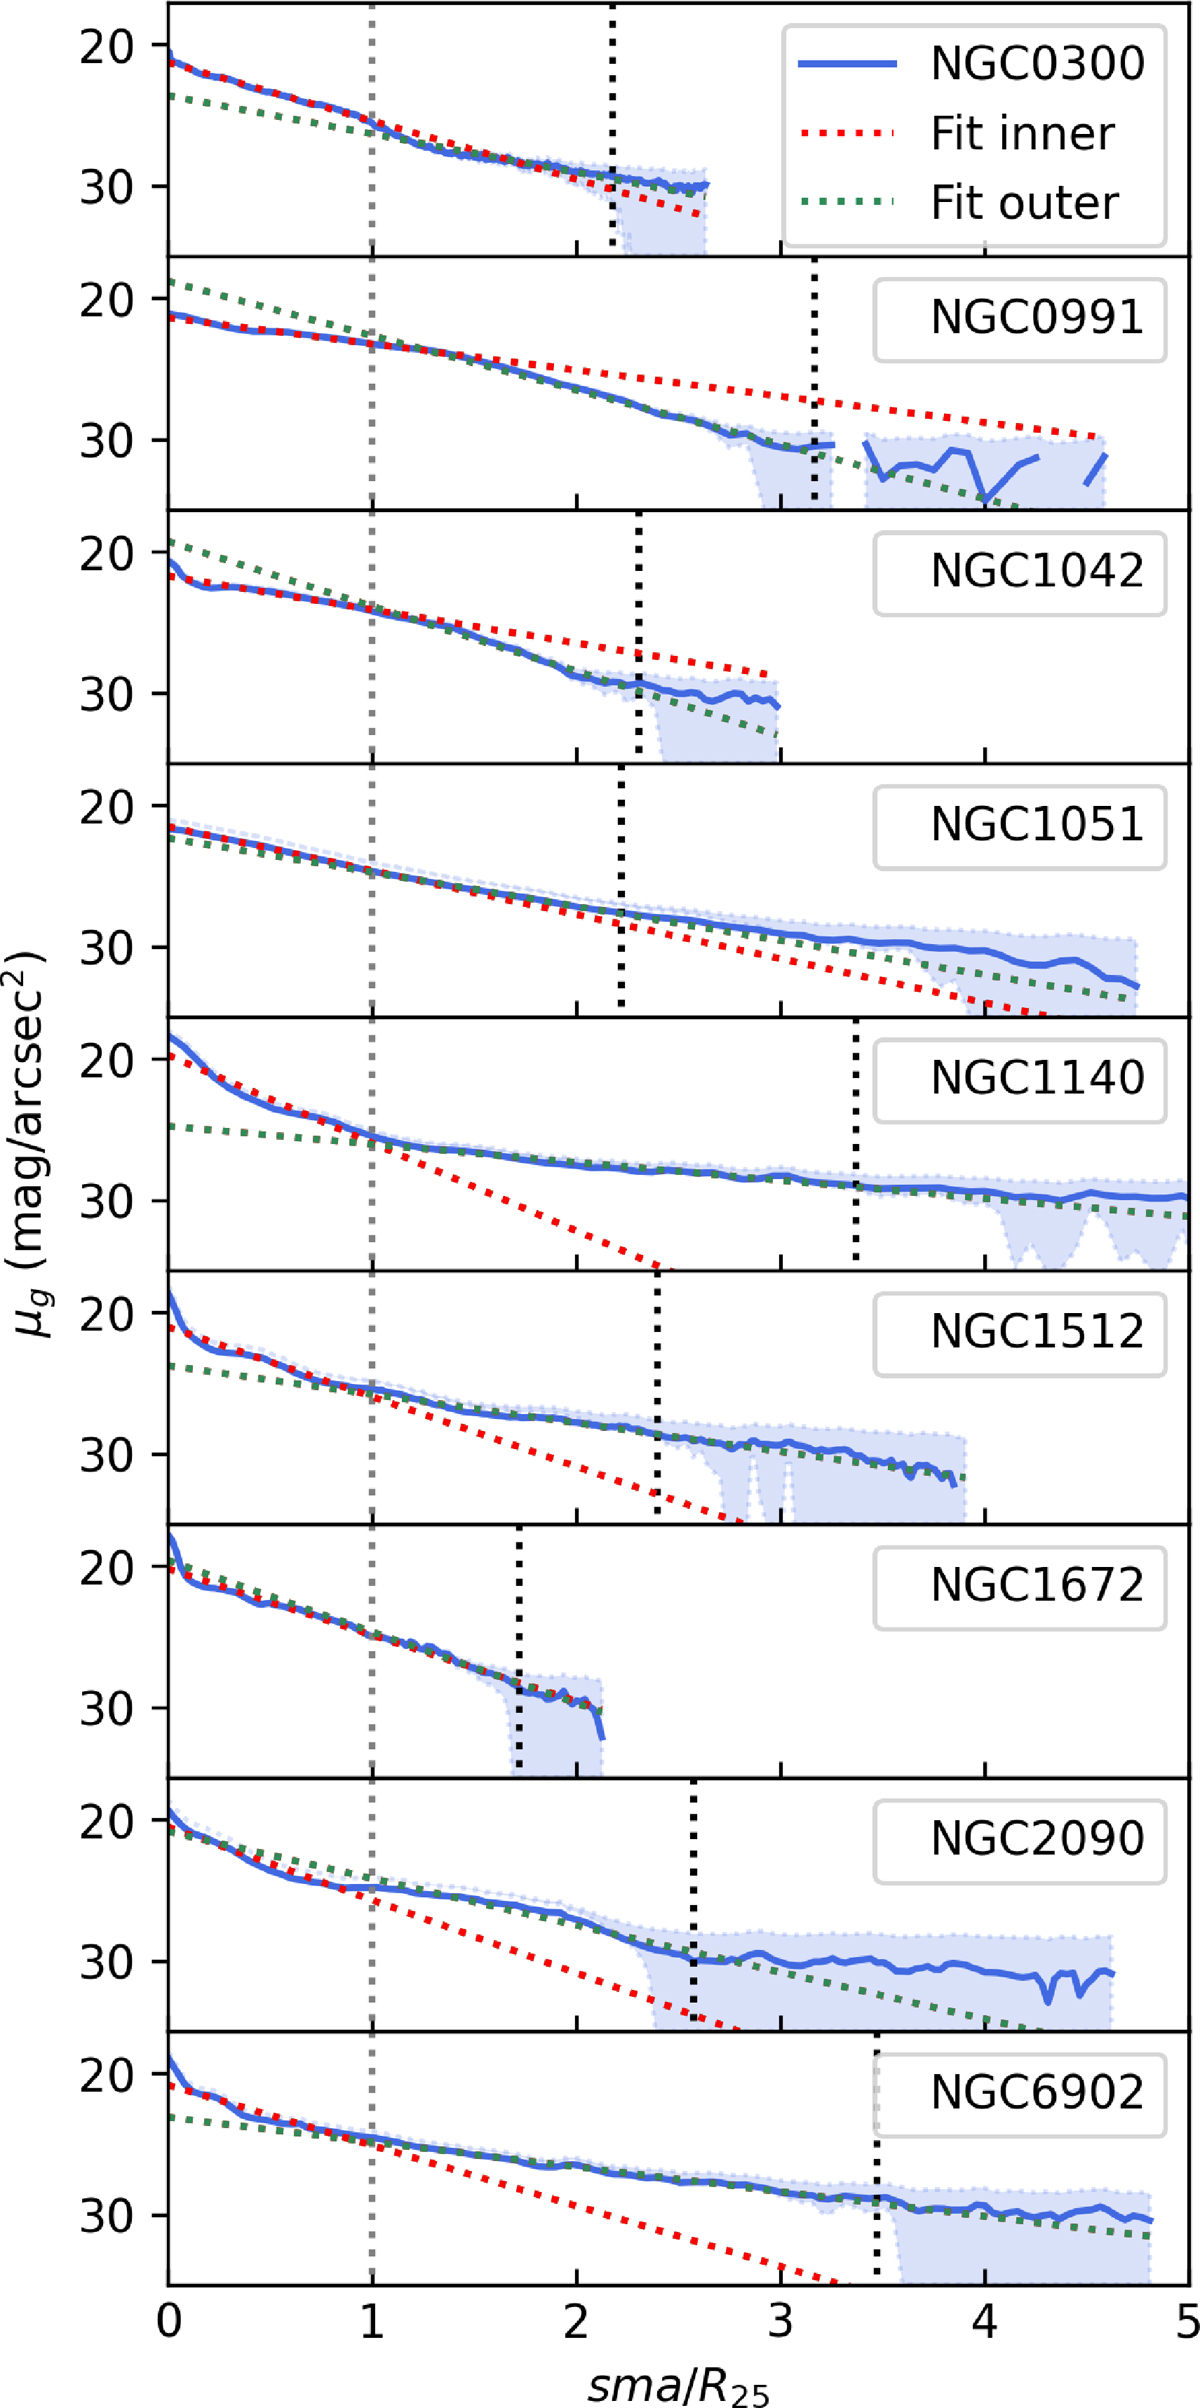
Surface brightness profiles in g band of the sample as a function of the radius normalized by R25. The dashed gray line is the R25 and the black one is the RUV. The dotted green line is the fit in the outer region and the dotted red line is the fit in the inner region.
Current usage metrics show cumulative count of Article Views (full-text article views including HTML views, PDF and ePub downloads, according to the available data) and Abstracts Views on Vision4Press platform.
Data correspond to usage on the plateform after 2015. The current usage metrics is available 48-96 hours after online publication and is updated daily on week days.
Initial download of the metrics may take a while.