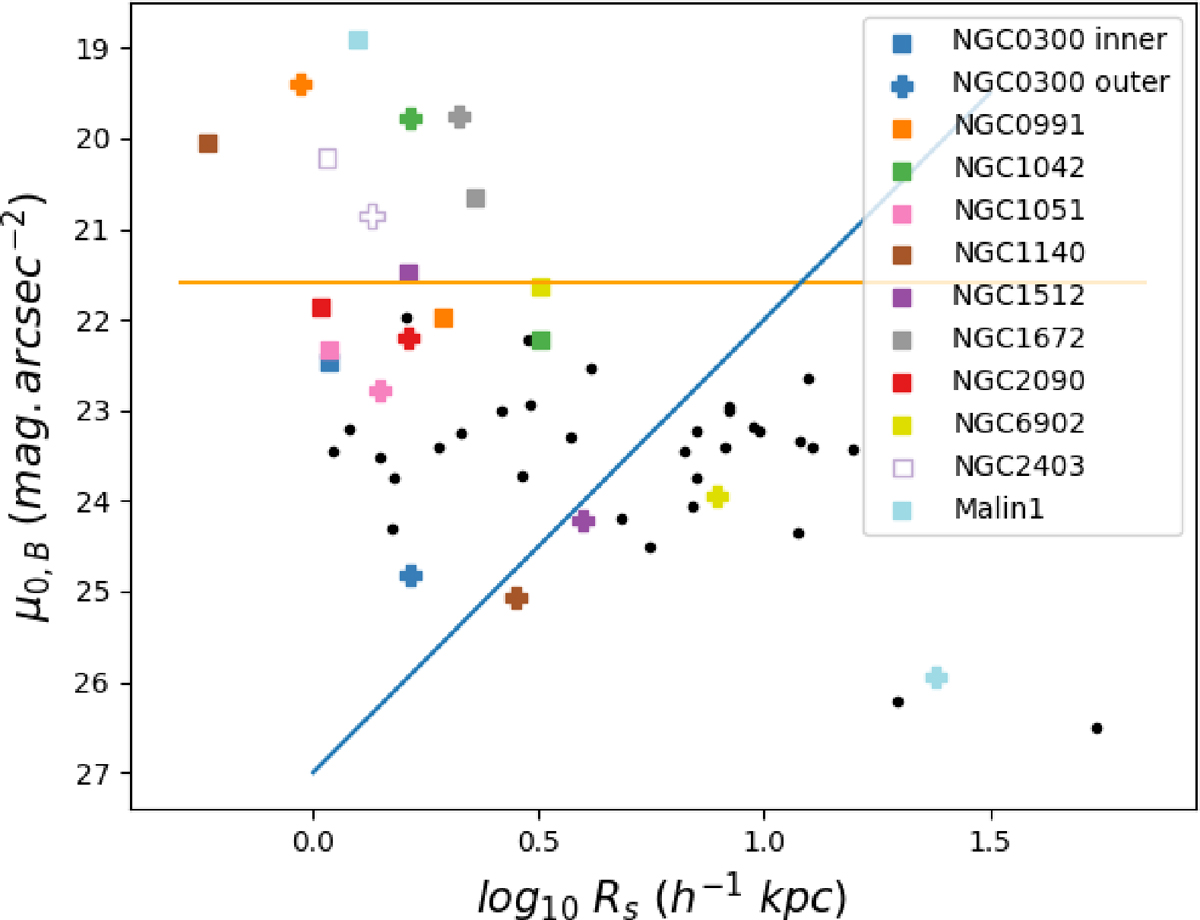
Fig. 6.
Download original image
Classification of the sample adapted from Sprayberry et al. (1995), Hagen et al. (2016). The squares symbols represent the value of the disk fit for the inner part of the galaxies and the cross symbols for the extended UV region. The blue line distinguishes the Low Surface Brightness (LSB) galaxies from the Giant LSB (GLSB) galaxies. The orange line, which represents the Freeman (1970) value (21.65 mag.arcsec−2), separates the high surface brightness (HSB) galaxies from the LSB galaxies. In order to compare with the data of McGaugh & Bothun (1994), Sprayberry et al. (1995), and Hagen et al. (2016) (black dots) calculated with H0 = 100 h km s−1 Mpc−1, we corrected the Scalelength with h−1.
Current usage metrics show cumulative count of Article Views (full-text article views including HTML views, PDF and ePub downloads, according to the available data) and Abstracts Views on Vision4Press platform.
Data correspond to usage on the plateform after 2015. The current usage metrics is available 48-96 hours after online publication and is updated daily on week days.
Initial download of the metrics may take a while.