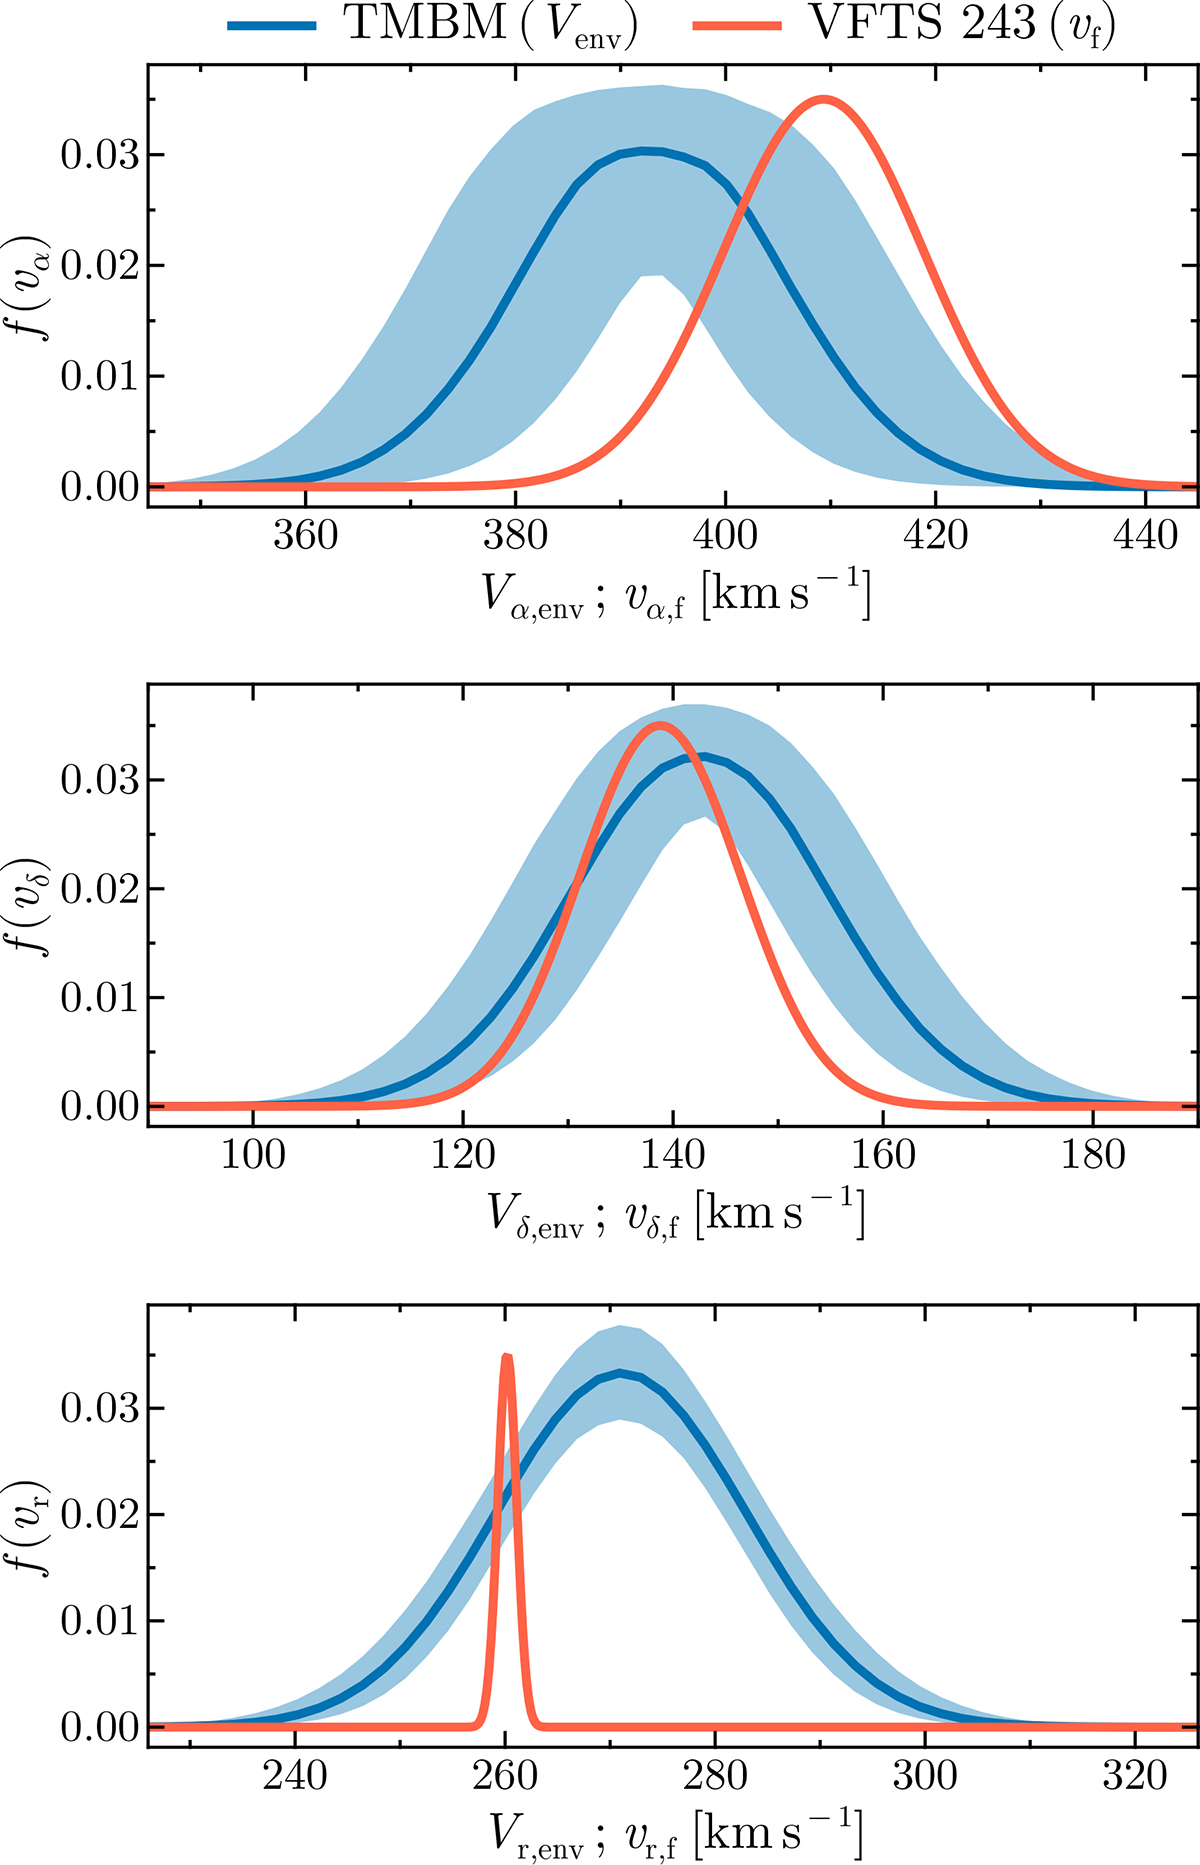
Fig. 2.
Download original image
Velocity distributions for VFTS 243 and its host association. The measured velocity components for VFTS 243 (red), compared to the inferred dispersion of its birth association, the Tarantula nebula (blue, arbitrary scaling), estimated from the massive binaries in the TMBM survey. From top to bottom, the panels show the velocity in the direction of increasing RA and in the direction of increasing Dec and in the radial direction. For the Tarantula dispersion, a 90% credible interval of the inferred distributions is shown.
Current usage metrics show cumulative count of Article Views (full-text article views including HTML views, PDF and ePub downloads, according to the available data) and Abstracts Views on Vision4Press platform.
Data correspond to usage on the plateform after 2015. The current usage metrics is available 48-96 hours after online publication and is updated daily on week days.
Initial download of the metrics may take a while.