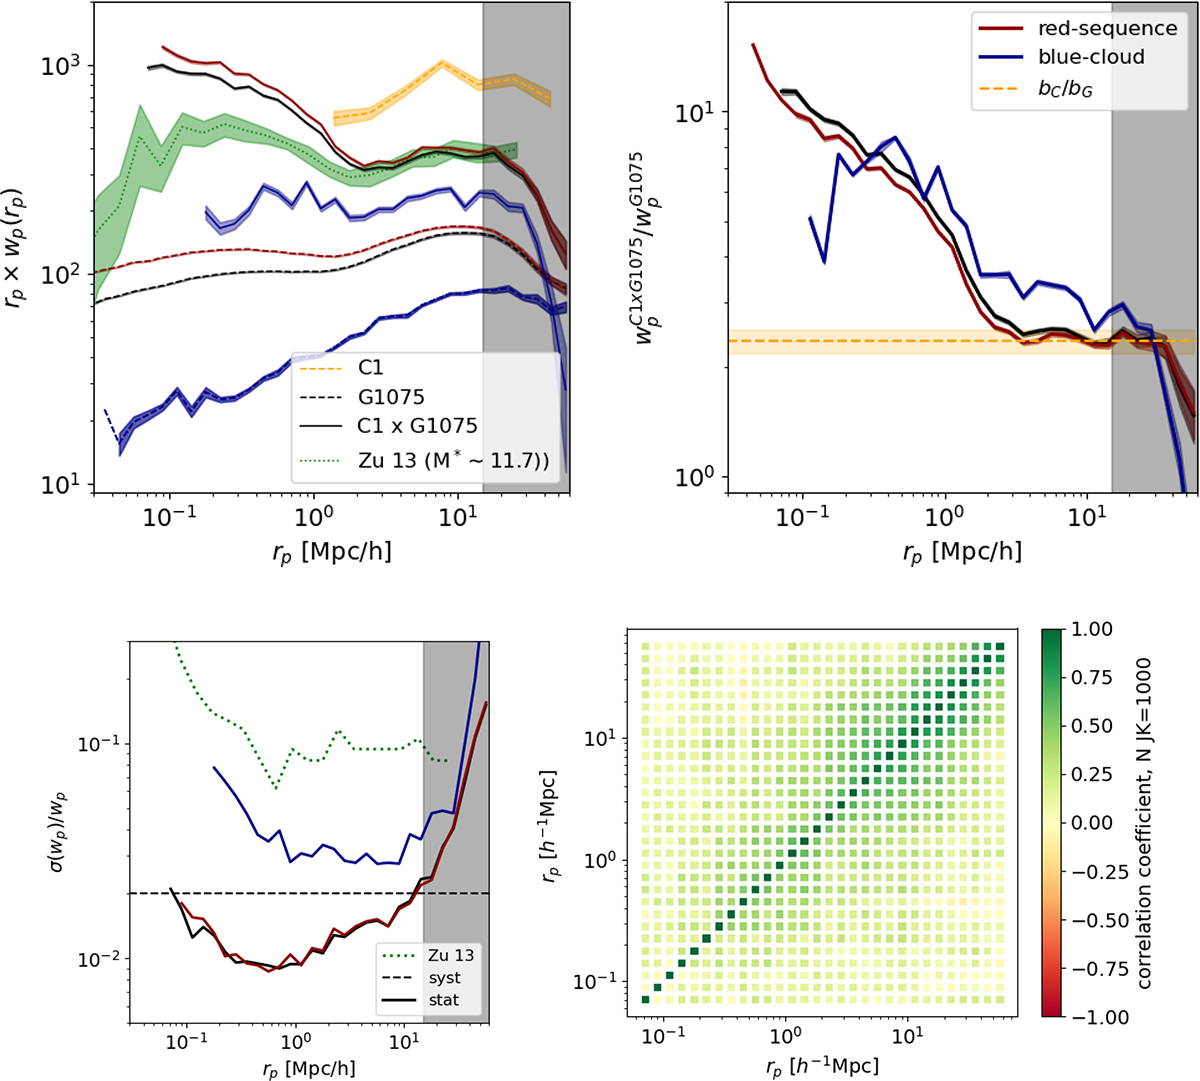
Fig. 1.
Download original image
Correlation functions for the C1xG1075 sample, using C1 clusters (0.1 < z < 0.3, log10(LX [erg/s]) > 43.1) and G1075 galaxies (10.75 < log10(M*[M⊙]) < 12). Left: Projected autocorrelation functions of galaxies (and clusters), split into red-sequence (red) and blue-cloud (blue) are shown with dashed lines; projected cluster-galaxy cross-correlation functions are shown as solid lines. This signal is dominated by the red sequence galaxies: the red lines are significantly higher than the blue lines. For comparison, we show the measurement from Zu & Weinberg (2013), who cross-correlated SDSS galaxies with galaxy groups from Yang et al. (2007), whose brightest group galaxy has a stellar mass in the range (11.4 < log10(MBGG*[M⊙]) < 11.9). This measurement is shown as a green dotted line. In this analysis, we trust the measurements up to 15 h−1Mpc (to the left of the shaded area), beyond which they may be affected by systematics uncertainties. Right: Ratio between the galaxy-cluster cross-correlation and the corresponding galaxy autocorrelations. This comparison shows the strength of the clustering in the cluster environment relative to that of all galaxies (i.e. galaxies in any environment). The ratio is above one, indicating that galaxies cluster more strongly near galaxy clusters. For red-sequence galaxies, the extra power in clustering increases when scales decrease. For blue-cloud galaxies, the clustering increases towards small scales down to 0.3 Mpc/h, where it stalls and decreases below 0.2 Mpc/h. The green horizontal line indicates the ratio of large-scale halo biases determined in Seppi et al. (2024) and Comparat et al. (2025), which aligns with the ratio of correlation functions on large scales, as expected. Bottom: Results of the Jackknife procedure. Left: Relative uncertainties for cross-correlation functions. Right: Cross-correlation coefficient for the C1xG1075 sample. Relative uncertainties range from 1% to 10%; previous SDSS measurement showed 10%-30% uncertainties. The high density of galaxies in LS10 enables increased measurement precision.
Current usage metrics show cumulative count of Article Views (full-text article views including HTML views, PDF and ePub downloads, according to the available data) and Abstracts Views on Vision4Press platform.
Data correspond to usage on the plateform after 2015. The current usage metrics is available 48-96 hours after online publication and is updated daily on week days.
Initial download of the metrics may take a while.