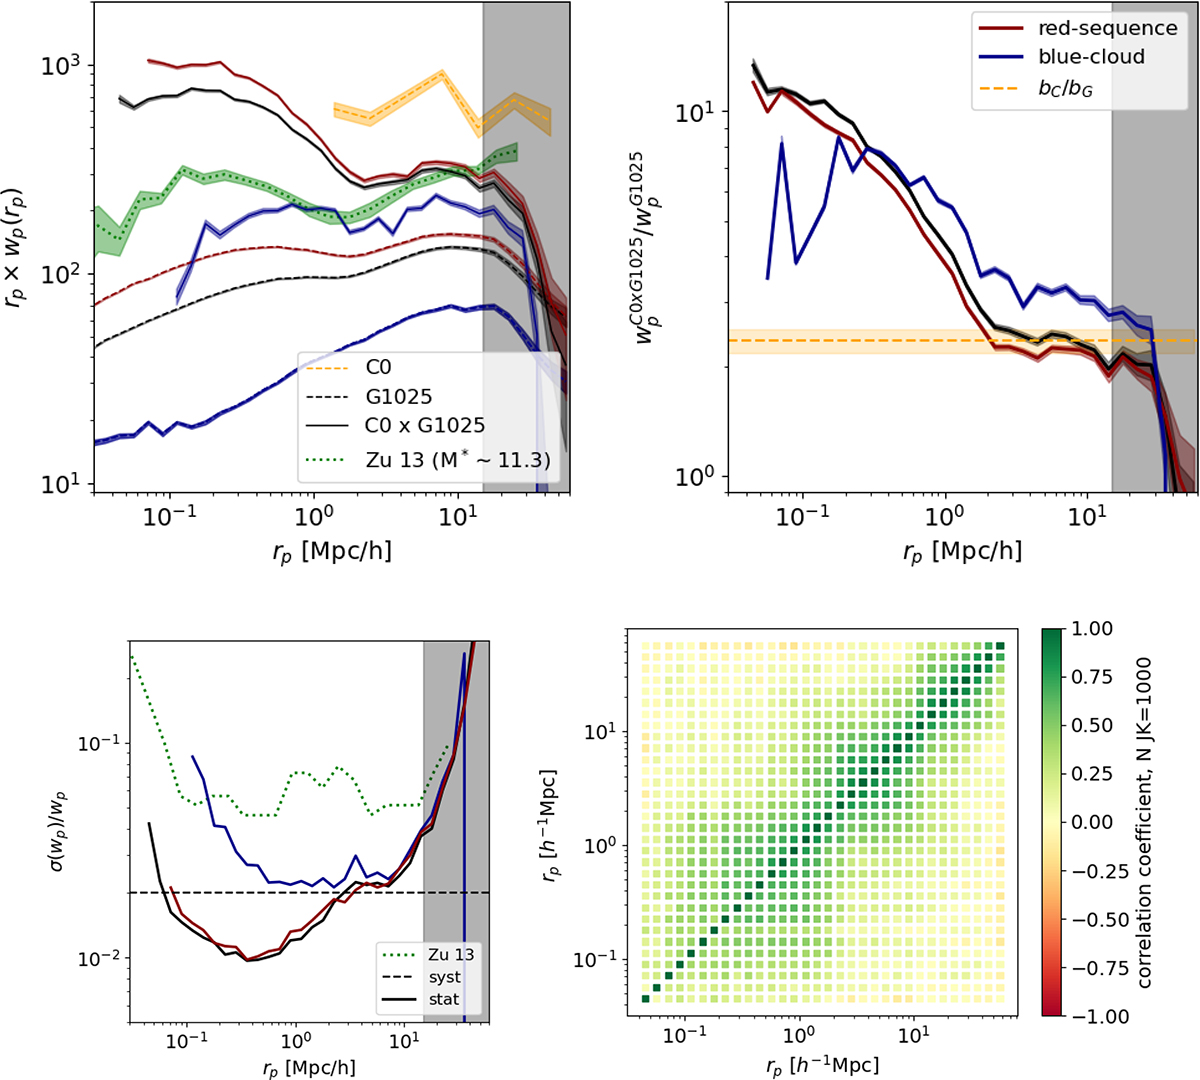
Fig. 2.
Download original image
Correlation functions for the C0xG1025 sample, continued from Fig. 1. These are measured using the C0 cluster sample (0.1 < z < 0.2, log10(LX [erg/s]) > 42.7) in combination with the G1025 galaxy sample (10.25 < log10(M*[M⊙]) < 12). A comparison is provided using the measurement from Zu & Weinberg (2013), showing the group-galaxy cross-correlation for the sample of Yang et al. (2007), with brightest group galaxies in the stellar mass range (11.2 < log10(MBGG*[M⊙]) < 11.4) and all SDSS galaxies. This result is shown as a dotted line.
Current usage metrics show cumulative count of Article Views (full-text article views including HTML views, PDF and ePub downloads, according to the available data) and Abstracts Views on Vision4Press platform.
Data correspond to usage on the plateform after 2015. The current usage metrics is available 48-96 hours after online publication and is updated daily on week days.
Initial download of the metrics may take a while.