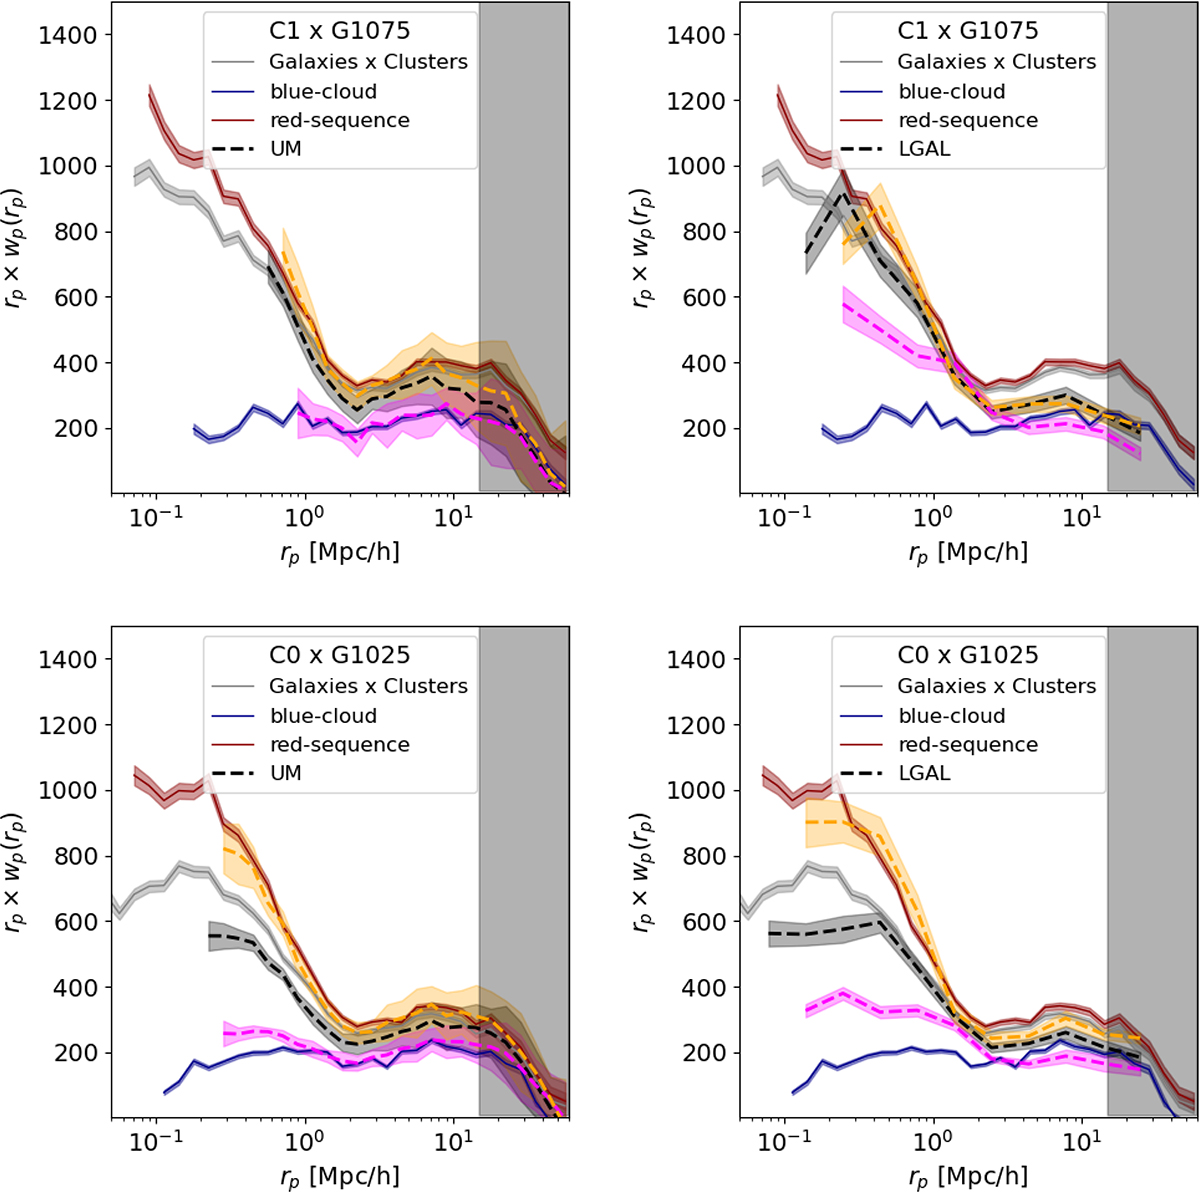
Fig. 3.
Download original image
Galaxy-cluster cross-correlation functions compared to model predictions from the Uchuu+UniverseMachine (UM) model (Aung et al. 2023, left column) and LGAL model (Ayromlou et al. 2021 right column). Results are shown for the compared to the C1xG1075 (top) and C0xG1025 (bottom) combinations Model prediction are shown in orange for red-sequence galaxies and in pink for blue-cloud galaxies. The UM model agrees well with the C1xG1075 observations. At lower redshift, for lower stellar mass galaxies, the UM model exhibits a mild discrepancy with the observations, suggesting that the quiescent fraction of cluster galaxies with stellar mass of ∼10.5 may be underestimated. The LGAL model agrees with the measurements of the complete galaxy population (gray lines) and red galaxies (red and orange lines) for both he C1xG1075 and the C0xG1025 combinations, down to 0.5 Mpc/h. The LGAL blue-cloud galaxies show excess power on small scales compared to the observations.
Current usage metrics show cumulative count of Article Views (full-text article views including HTML views, PDF and ePub downloads, according to the available data) and Abstracts Views on Vision4Press platform.
Data correspond to usage on the plateform after 2015. The current usage metrics is available 48-96 hours after online publication and is updated daily on week days.
Initial download of the metrics may take a while.