Open Access
Fig. 4.
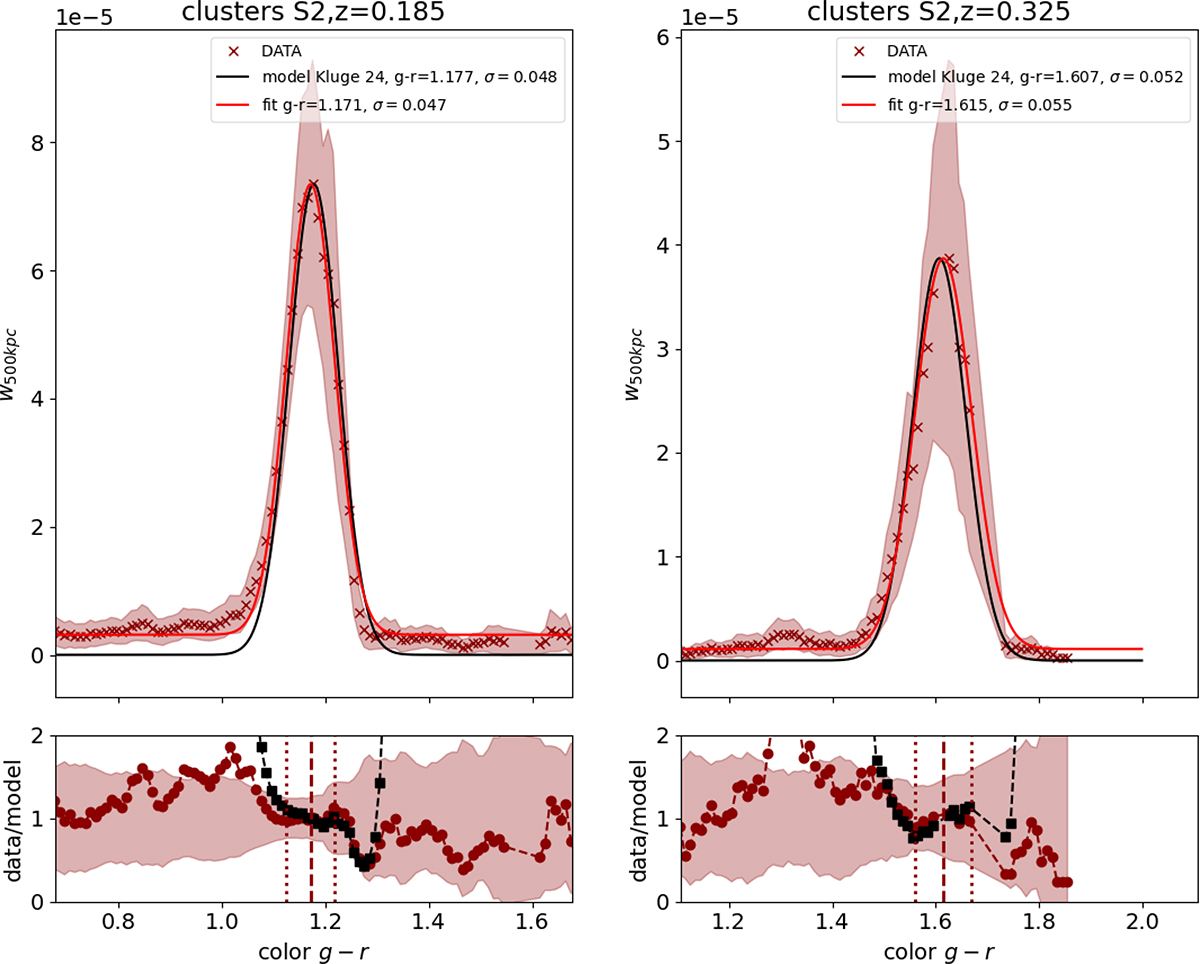
Download original image
Measured integral of the cross-correlation function up to 500 kpc as a function of color at redshift 0.195 (left column) and 0.325 (right column). A Gaussian model was fit to the data points (red) and is compared to the model from Kluge et al. (2024) (in black), showing good agreement.
Current usage metrics show cumulative count of Article Views (full-text article views including HTML views, PDF and ePub downloads, according to the available data) and Abstracts Views on Vision4Press platform.
Data correspond to usage on the plateform after 2015. The current usage metrics is available 48-96 hours after online publication and is updated daily on week days.
Initial download of the metrics may take a while.