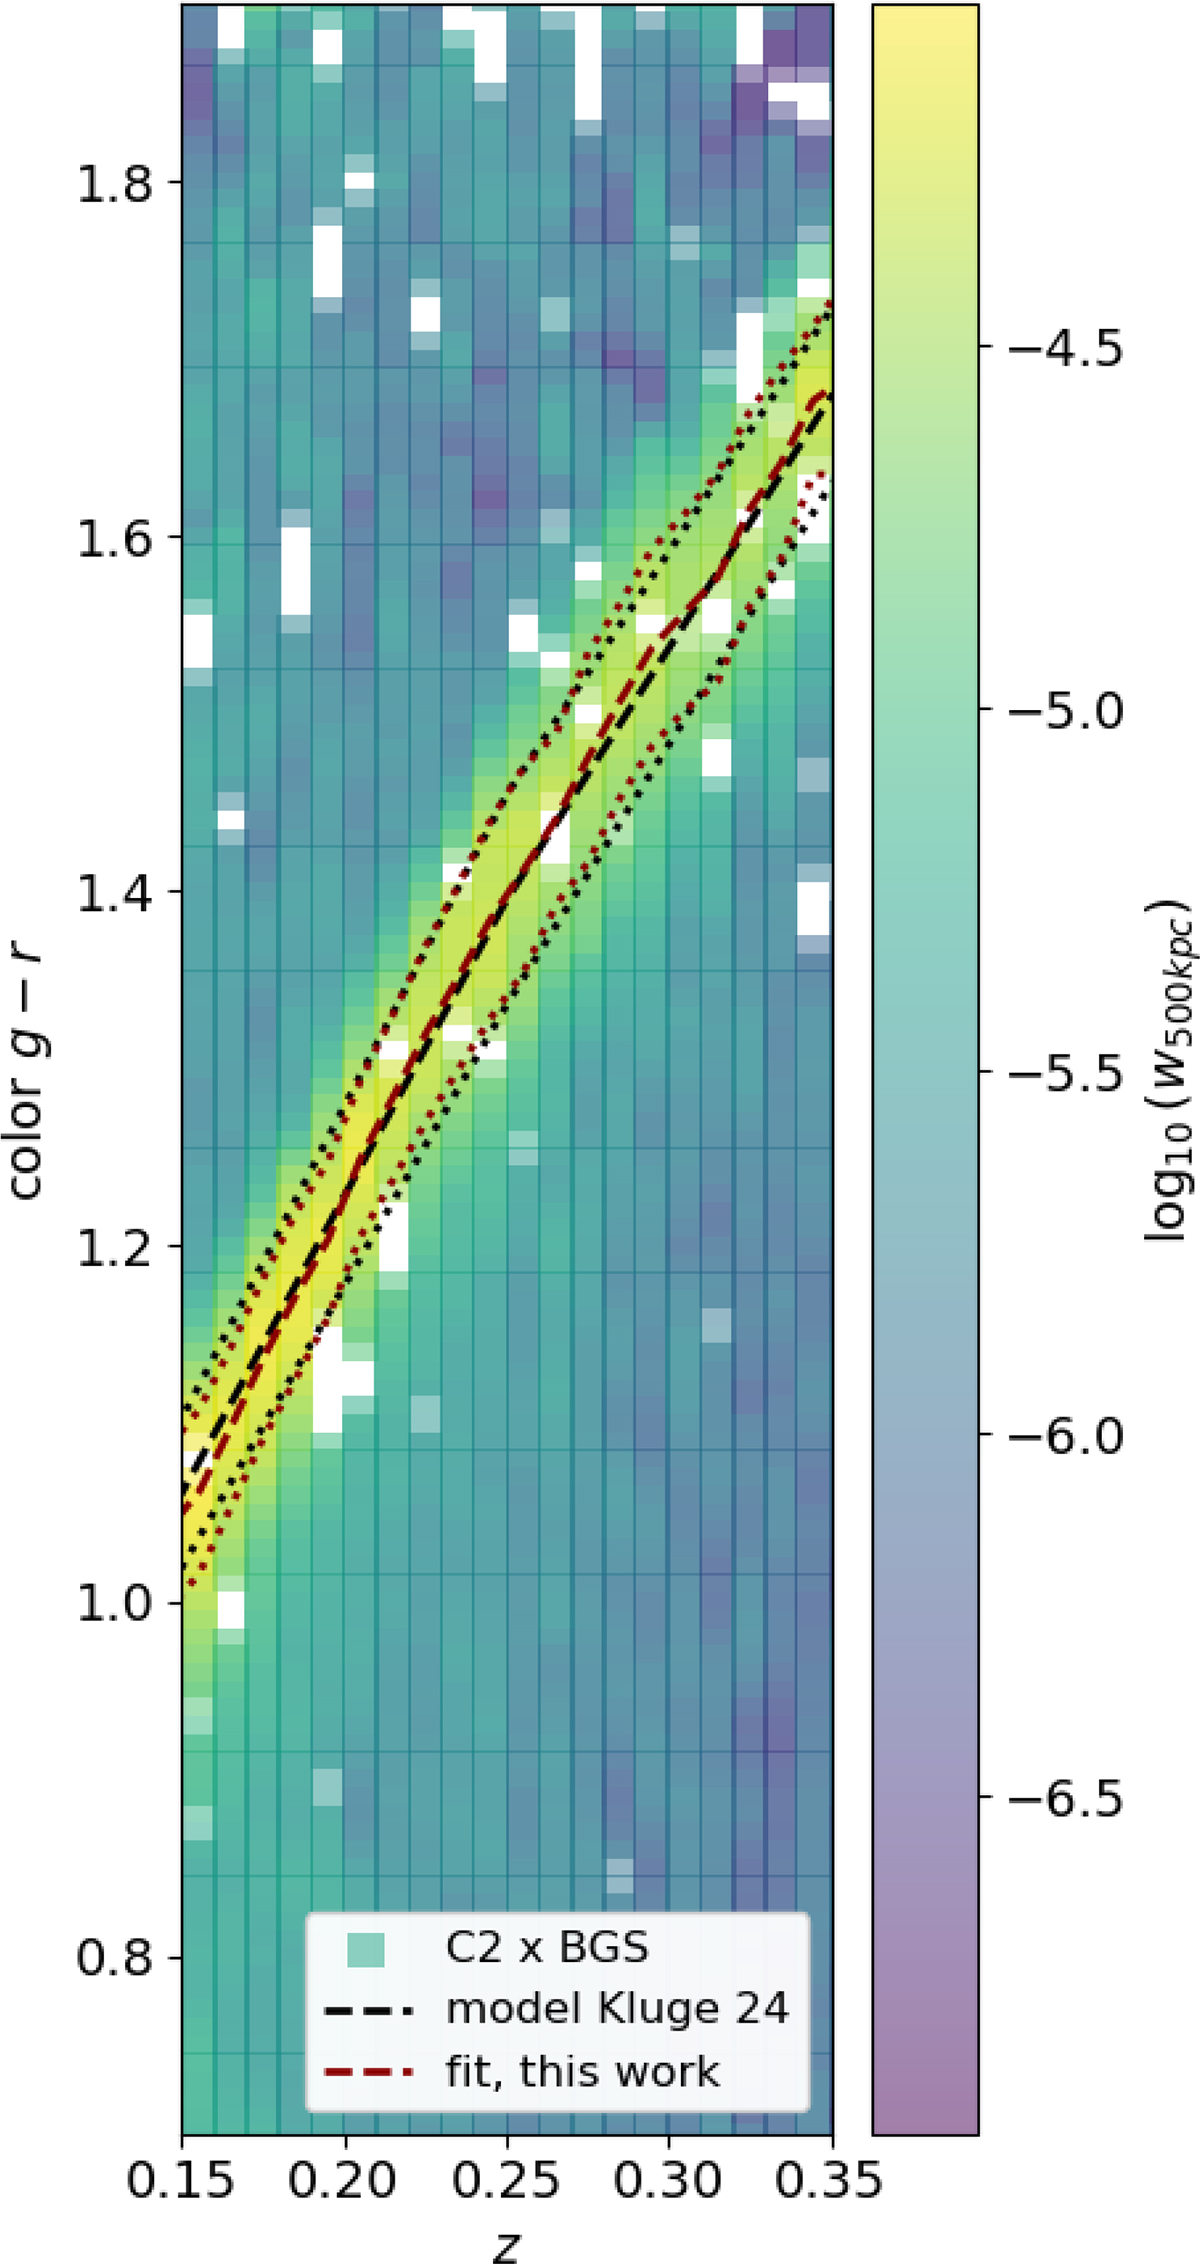
Fig. 5.
Download original image
Redshift vs. g-r color, coded by the integral of the cross-correlation function up to 500 kpc. Colored symbols represent individual cross-correlation functions. Dashed red lines indicate the models derived for each redshift slice. Black lines show the red-sequence model from Kluge et al. (2024). Red sequence and its scatter are accurately recovered.
Current usage metrics show cumulative count of Article Views (full-text article views including HTML views, PDF and ePub downloads, according to the available data) and Abstracts Views on Vision4Press platform.
Data correspond to usage on the plateform after 2015. The current usage metrics is available 48-96 hours after online publication and is updated daily on week days.
Initial download of the metrics may take a while.