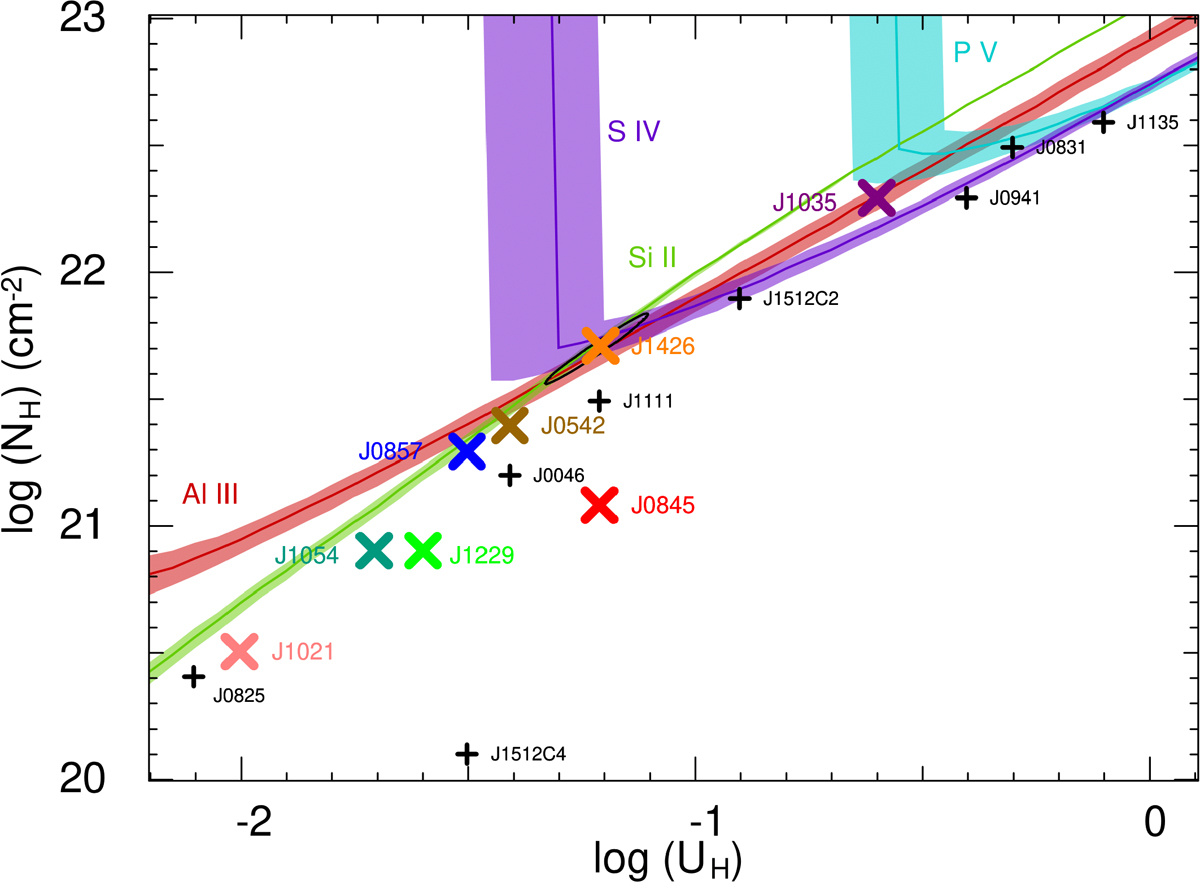
Fig. 1.
Download original image
Phase-space plot showing the NH and UH solutions for the DESI sample (colored Xs) and the VLT sample of Xu et al. (2019) (black plus signs). The colored lines and associated shaded regions indicate the Nion constraints (measurements and errors, respectively) used to derive the NH and UH solutions for the outflow detected in J1426+3151. The phase-space solution with minimized χ2 is shown as an orange cross surrounded by a black eclipse indicating the 1σ error.
Current usage metrics show cumulative count of Article Views (full-text article views including HTML views, PDF and ePub downloads, according to the available data) and Abstracts Views on Vision4Press platform.
Data correspond to usage on the plateform after 2015. The current usage metrics is available 48-96 hours after online publication and is updated daily on week days.
Initial download of the metrics may take a while.