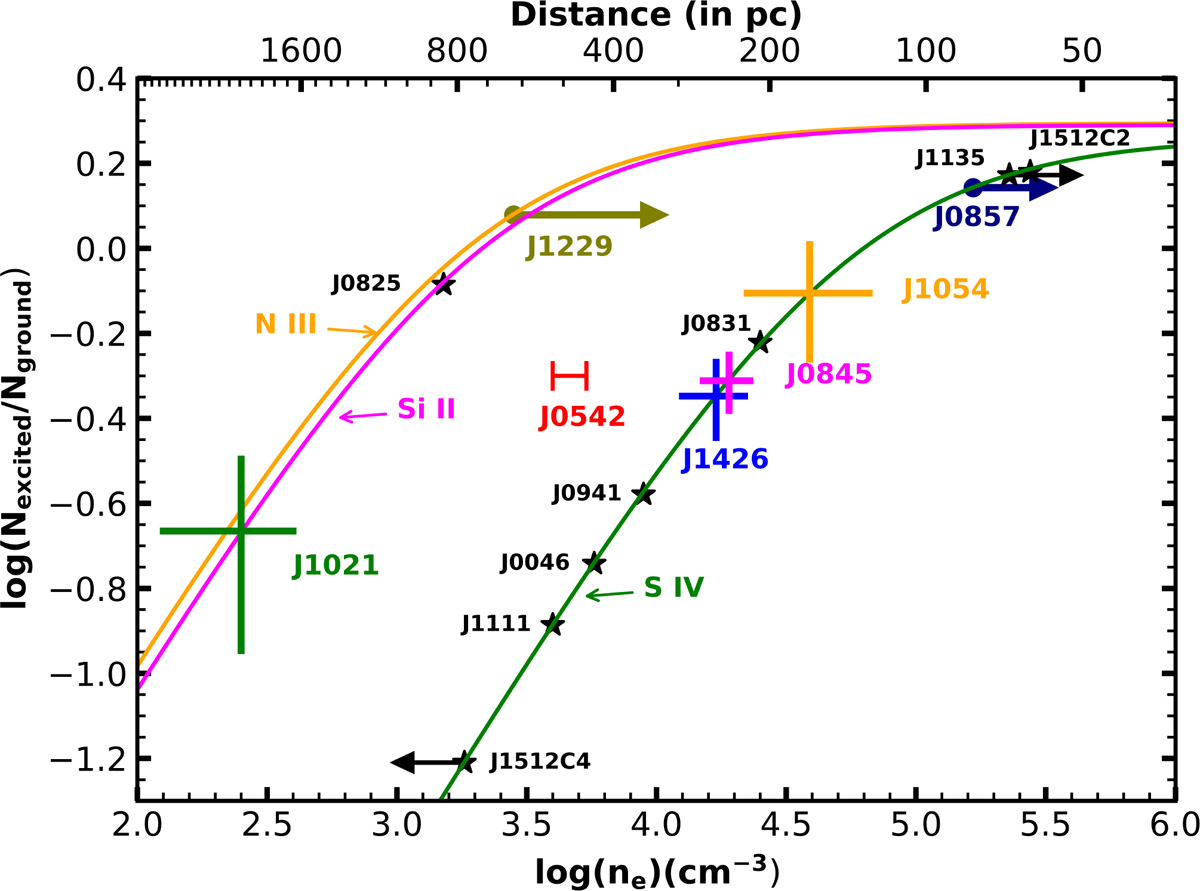
Fig. 2.
Download original image
Theoretical population ratios for different ionic species at Te = 15 000 K (solid curves). The vertical part of each cross represents the observed column density ratio and its error for each outflowing system, while the horizontal part represents the associated ne error. The arrows indicate lower limits obtained from possibly saturated troughs corresponding to these species. The case of J0542 is explained in Section 6.1. The top axis shows the distance scale based on the outflow detected in J1426+3151. The black stars and arrows correspond to objects from Xu et al. (2019).
Current usage metrics show cumulative count of Article Views (full-text article views including HTML views, PDF and ePub downloads, according to the available data) and Abstracts Views on Vision4Press platform.
Data correspond to usage on the plateform after 2015. The current usage metrics is available 48-96 hours after online publication and is updated daily on week days.
Initial download of the metrics may take a while.