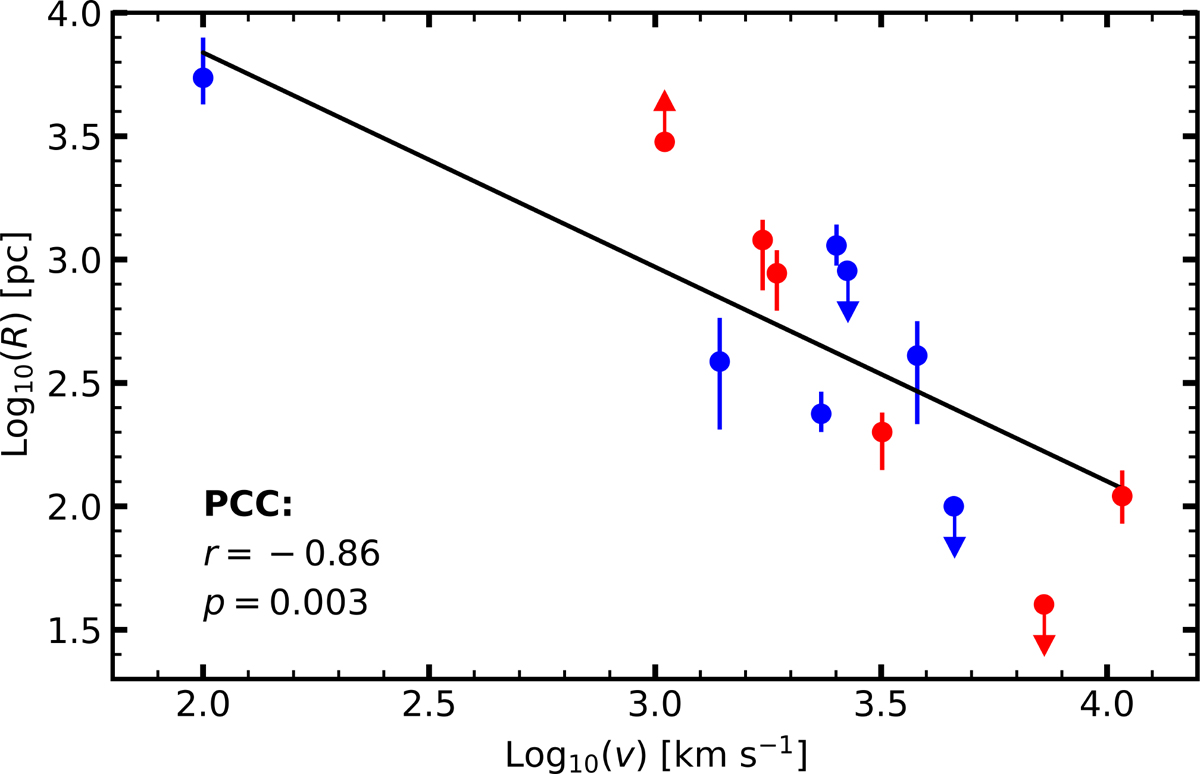
Fig. 3.
Download original image
Distribution of log(R) versus log(|v|) for the combined S IV sample. Objects analyzed in this work are shown in blue, and objects from Xu et al. (2019) are shown in red. The sample shows a strong negative correlation with a PCC of −0.86; this drops to −0.68 if the lowest velocity outflow is excluded. The black line shows the best-fit log-linear relationship, given by log(R) = −0.87 log(|v|) + 5.58.
Current usage metrics show cumulative count of Article Views (full-text article views including HTML views, PDF and ePub downloads, according to the available data) and Abstracts Views on Vision4Press platform.
Data correspond to usage on the plateform after 2015. The current usage metrics is available 48-96 hours after online publication and is updated daily on week days.
Initial download of the metrics may take a while.