Fig. 4.
Download original image
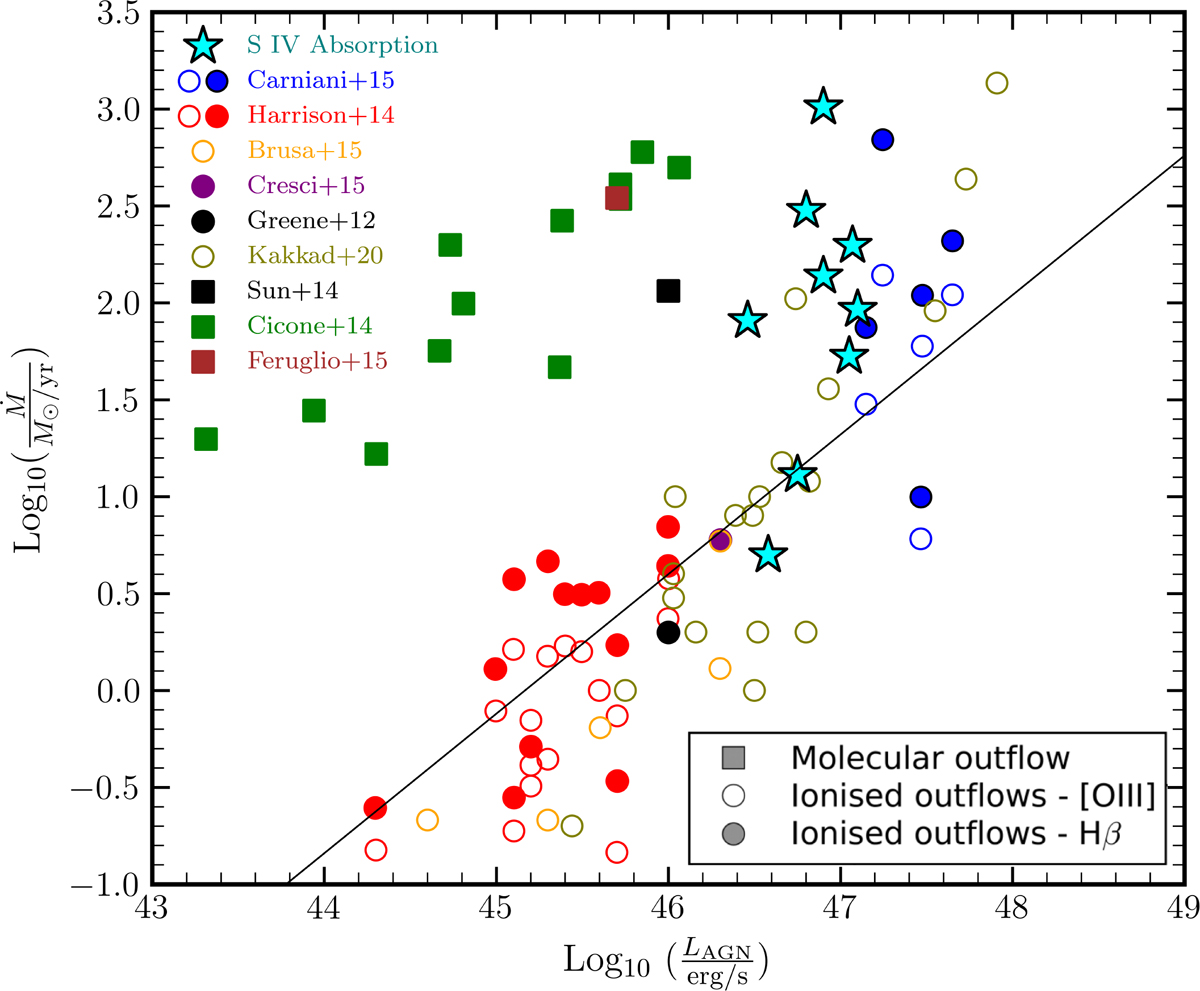
Mass outflow rates (Ṁ) as a function of AGN bolometric luminosity (adapted from Fig. 9 of Carniani et al. 2015, with permission). Teal stars represent our combined S IV sample seen in absorption. Open and filled circles indicate the Ṁ for ionized outflows determined from [O III] and H β emission lines, respectively. Squares denote molecular outflows.
Current usage metrics show cumulative count of Article Views (full-text article views including HTML views, PDF and ePub downloads, according to the available data) and Abstracts Views on Vision4Press platform.
Data correspond to usage on the plateform after 2015. The current usage metrics is available 48-96 hours after online publication and is updated daily on week days.
Initial download of the metrics may take a while.