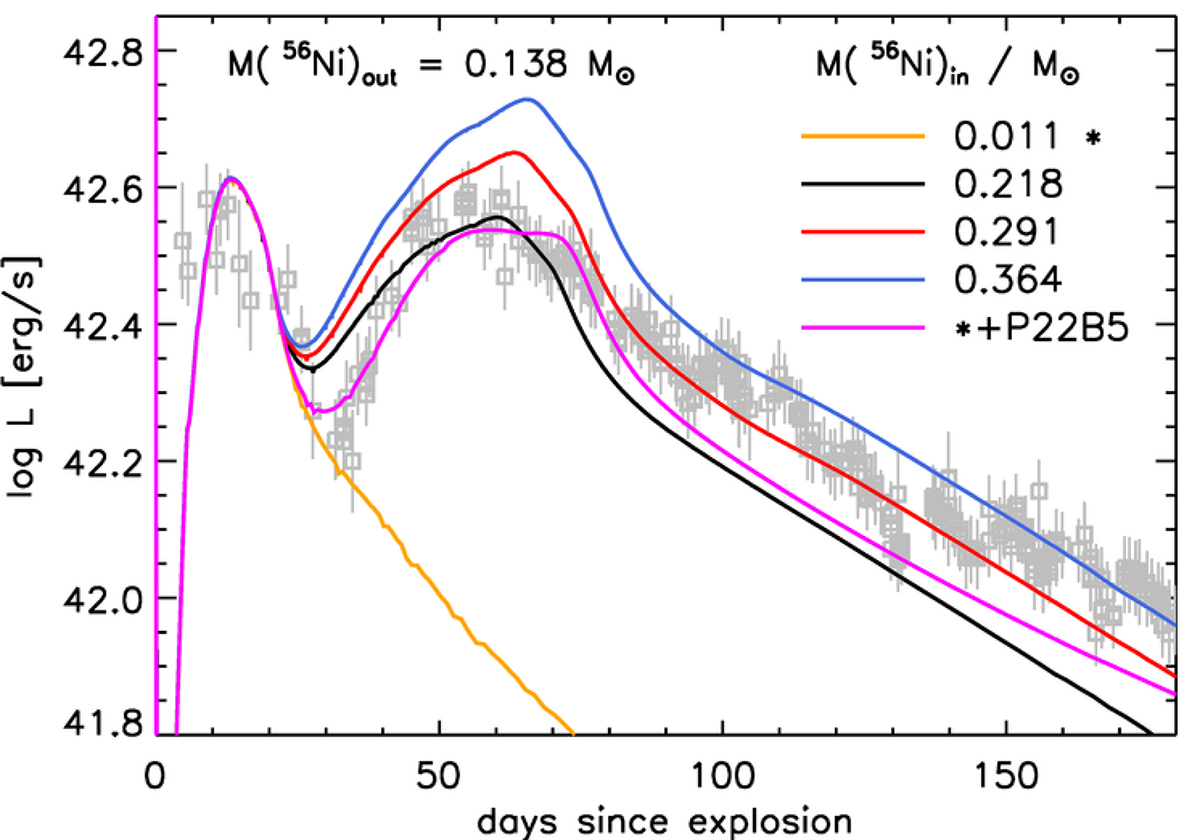
Fig. 1.
Download original image
Light curve comparison between the SN observations (gray markers; Chen et al. 2024 bolometric) and the bolometric output from our double-peaked 56Ni distribution model. The inner component of the distribution is varied, while a fixed outer component of the profile is set to provide a reasonable fit for the first maximum of the LC. The model including a magnetar component is shown in magenta. In all the cases, the external enriched 56Ni shell is fixed, and the progenitor is the He11, as detailed in the text.
Current usage metrics show cumulative count of Article Views (full-text article views including HTML views, PDF and ePub downloads, according to the available data) and Abstracts Views on Vision4Press platform.
Data correspond to usage on the plateform after 2015. The current usage metrics is available 48-96 hours after online publication and is updated daily on week days.
Initial download of the metrics may take a while.