Open Access
Fig. 3.
Download original image
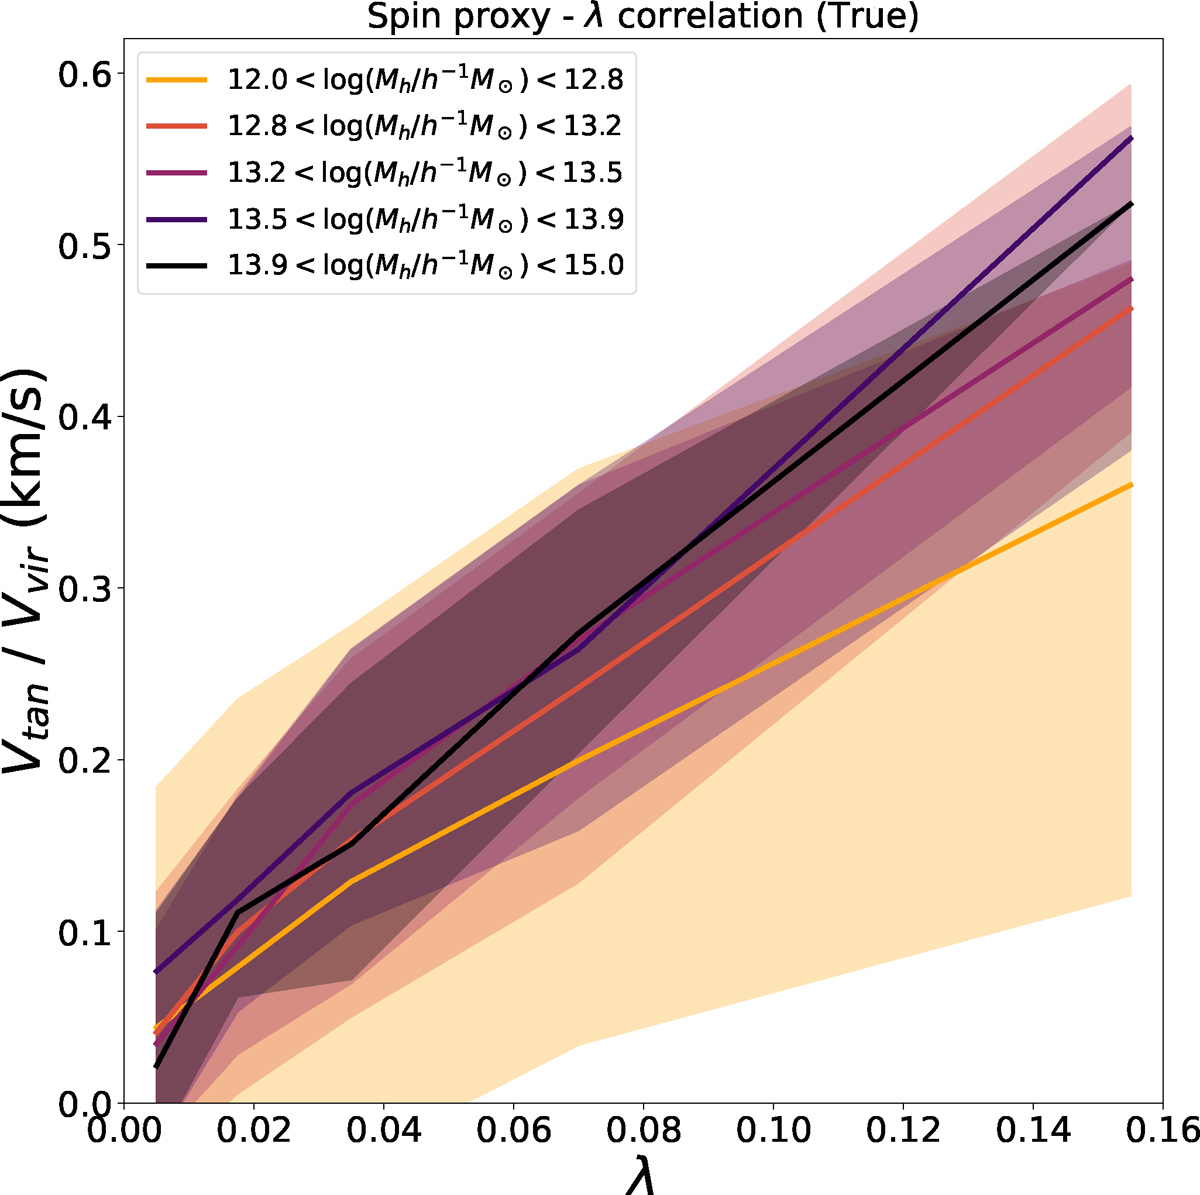
Correlation between the spin proxy and the true halo spin (λ) for several host halo mass bins in TNG300. The solid lines show the mean of the distribution, while the shaded regions indicate the interquartile range (25th to 75th percentiles). These measurements have been performed in 3D.
Current usage metrics show cumulative count of Article Views (full-text article views including HTML views, PDF and ePub downloads, according to the available data) and Abstracts Views on Vision4Press platform.
Data correspond to usage on the plateform after 2015. The current usage metrics is available 48-96 hours after online publication and is updated daily on week days.
Initial download of the metrics may take a while.