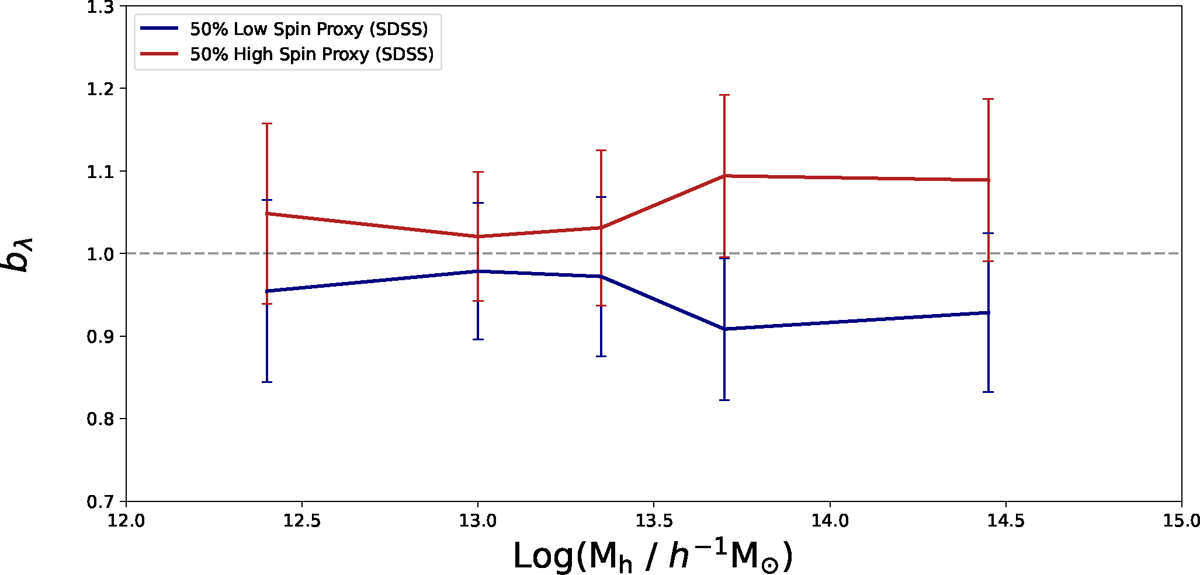
Fig. 6.
Download original image
Spin bias signal measured from the SDSS LowZ group catalog using the halo spin proxy, which is based on the SOC method. Red symbols and lines show results for the 50% higher spin proxy subset, while blue symbols and lines represent groups in the 50% lower spin proxy subset. Error computation details are provided in the text.
Current usage metrics show cumulative count of Article Views (full-text article views including HTML views, PDF and ePub downloads, according to the available data) and Abstracts Views on Vision4Press platform.
Data correspond to usage on the plateform after 2015. The current usage metrics is available 48-96 hours after online publication and is updated daily on week days.
Initial download of the metrics may take a while.