Fig. 7.
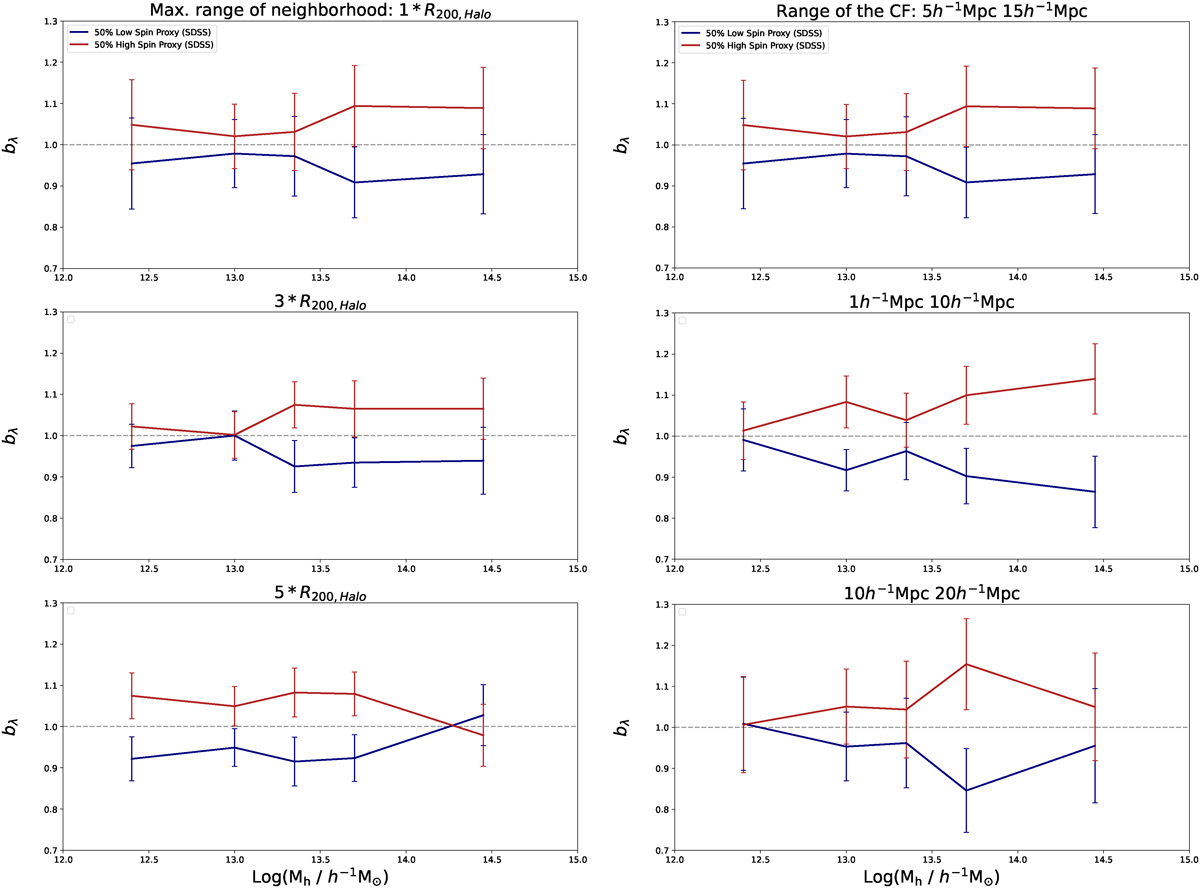
Download original image
Similar to Fig. 6 but varying the configuration parameters of our spin proxy. The left column shows the impact of varying the distance range of neighboring galaxies, while the right column displays results assuming different scale intervals for the computation of the cross-correlation function. We note that the fiducial result is shown in the top panels.
Current usage metrics show cumulative count of Article Views (full-text article views including HTML views, PDF and ePub downloads, according to the available data) and Abstracts Views on Vision4Press platform.
Data correspond to usage on the plateform after 2015. The current usage metrics is available 48-96 hours after online publication and is updated daily on week days.
Initial download of the metrics may take a while.