Fig. 3.
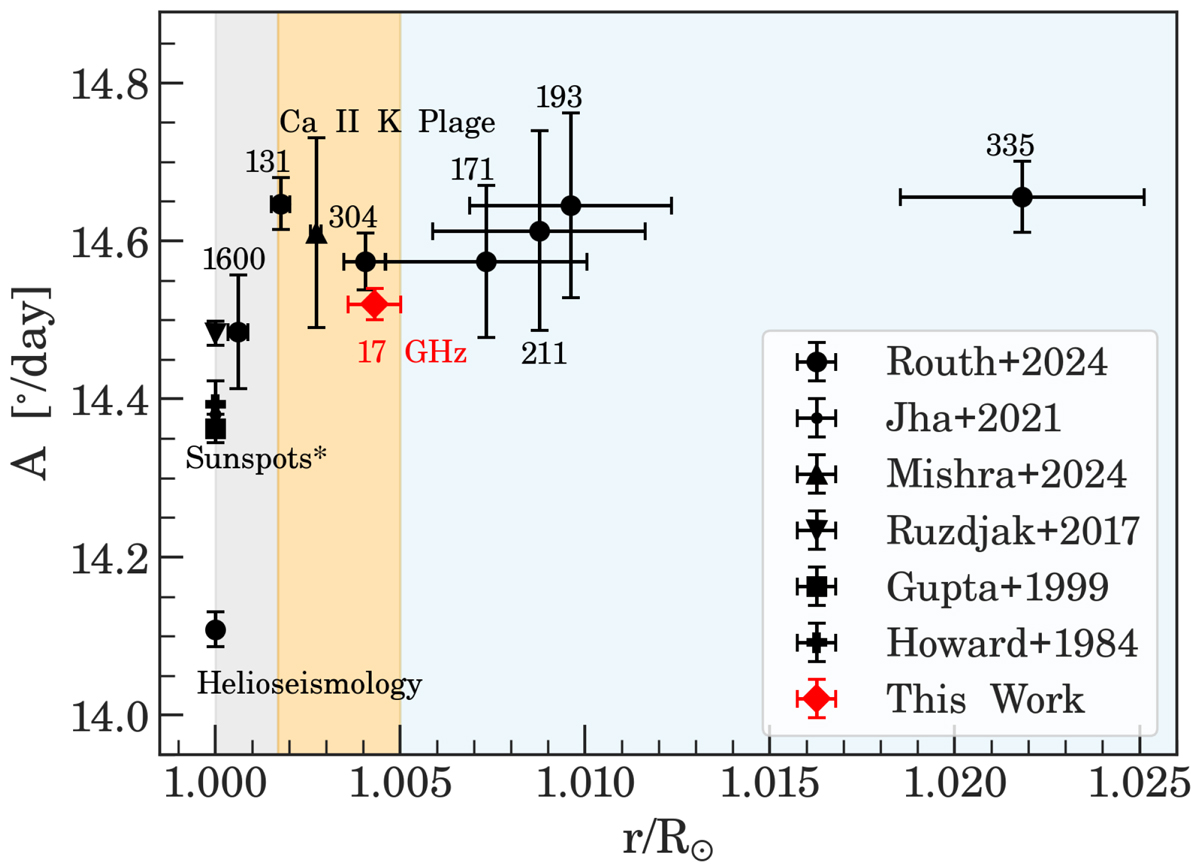
Download original image
Variation in equatorial rotation rate from the photosphere to different parts of the corona from recent works. The umbrella label of ‘sunspots’ is demarcated with an asterisk (*) to indicate different datasets used by different studies (see Appendix B). The extents of different layers of the solar atmosphere are shaded differently (photosphere in grey, chromosphere in gold, and corona in light blue) to allow distinction between the same. The heights representing the different temperature sensitive filters have been taken from Sanjay et al. (2024) (for 131 Å only) and the references in Routh et al. (2024). The representative height for 17 GHz has been obtained from Zirin (1988). The error bars along y represent a 3σ variation in the parameters, while along x the error bars represent the exact variation reported in the mentioned studies. A detailed table compiling all values in this figure and several other studies are available for reference in Appendix B.
Current usage metrics show cumulative count of Article Views (full-text article views including HTML views, PDF and ePub downloads, according to the available data) and Abstracts Views on Vision4Press platform.
Data correspond to usage on the plateform after 2015. The current usage metrics is available 48-96 hours after online publication and is updated daily on week days.
Initial download of the metrics may take a while.