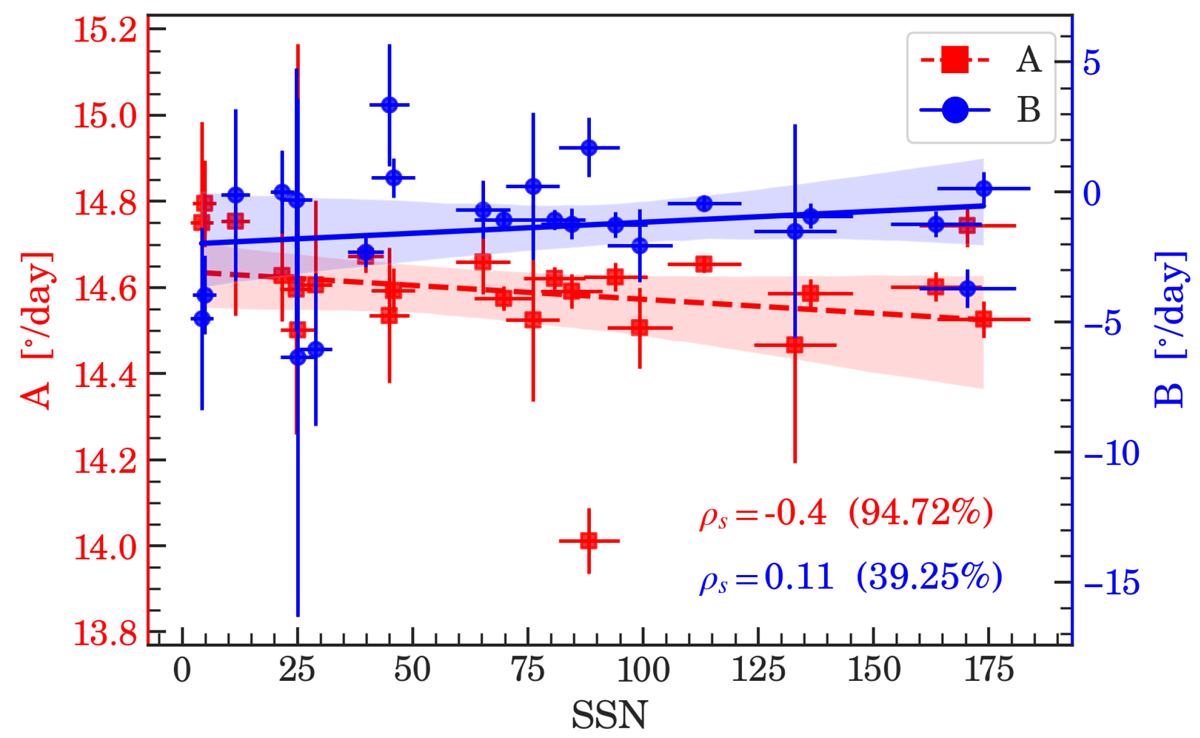
Fig. 4.
Download original image
Correlation plot of equatorial rotation rate (A; in red) and latitudinal gradient (B; in blue) with the yearly sunspot number and their error estimate in the y and x directions, respectively. The lines of best fit are exhibited to visualise the generalised trend in the correlation. The shaded regions with each line correspond to the confidence interval of the fit.
Current usage metrics show cumulative count of Article Views (full-text article views including HTML views, PDF and ePub downloads, according to the available data) and Abstracts Views on Vision4Press platform.
Data correspond to usage on the plateform after 2015. The current usage metrics is available 48-96 hours after online publication and is updated daily on week days.
Initial download of the metrics may take a while.