Fig. A.1.
Download original image
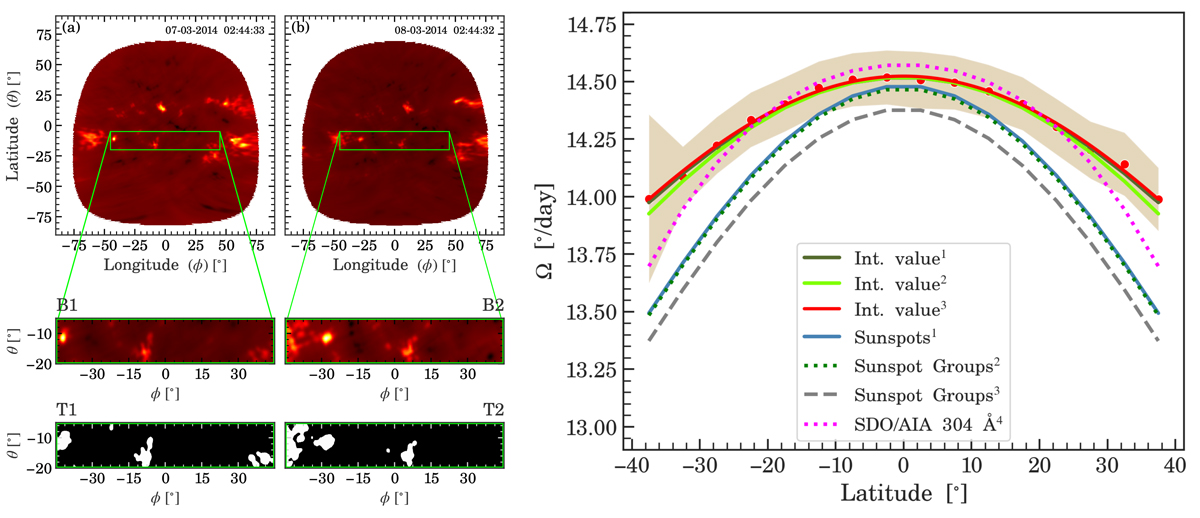
Left panel: Naobeyama images on (a) 7 March 2014 and (b) 8 March 2014 after the conversion to Stonyhurst heliographic coordinates. Green rectangular boxes depict the bins B1 and B2 (−20° to −5° in latitude, ±45° in longitude) used for image correlation. Bins T1 and T2 depict the dominant bright features in the same bins identified by adaptive intensity thresholding. Right panel: Rotational profiles for Nobeyama 17 GHz data using initial values from 1Ruždjak et al. (2017) and 2Poljančić Beljan et al. (2017) compared with the results using the same from 3Jha et al. (2021) and the values from 4Routh et al. (2024). Shaded areas denote uncertainties, detailed in section 3.
Current usage metrics show cumulative count of Article Views (full-text article views including HTML views, PDF and ePub downloads, according to the available data) and Abstracts Views on Vision4Press platform.
Data correspond to usage on the plateform after 2015. The current usage metrics is available 48-96 hours after online publication and is updated daily on week days.
Initial download of the metrics may take a while.