| Issue |
A&A
Volume 700, August 2025
|
|
|---|---|---|
| Article Number | A50 | |
| Number of page(s) | 11 | |
| Section | The Sun and the Heliosphere | |
| DOI | https://doi.org/10.1051/0004-6361/202555366 | |
| Published online | 04 August 2025 | |
Entropy proxy inversions as tracers of the evolution of physical conditions at the base of the solar convective envelope
1
STAR Institute, Université de Liège, Liège, Belgium
2
Sternberg Astronomical Institute, Lomonosov Moscow State University, 119234 Moscow, Russia
3
Stellar Astrophysics Centre, Department of Physics and Astronomy, Aarhus University, 8000 Aarhus C, Denmark
⋆ Corresponding author.
Received:
2
May
2025
Accepted:
4
June
2025
Abstract
Context. The Sun is an important calibrator in the theory of stellar structure and evolution. However, the accuracy of our solar evolution models is tightly linked to the physical elements that enter their computations. This includes, among others, the equation of state, the opacities, the transport of chemicals, and the modelling of turbulent convection. Deriving model-independent probes of these elements is therefore crucial to further testing the quality of these ingredients and potentially revealing their shortcomings using observational data.
Aims. We aim to provide additional constraints to the thermodynamic properties of the solar plasma at the base of the solar convective zone using a revised helioseismic indicator mimicking the properties of the specific entropy in the envelope.
Methods. We derived a revised entropy proxy for the solar convective envelope, which is directly accessible when using helioseismic structure inversions. We then used solar evolutionary models with various modifications of input physics to study the properties of the proxy of the entropy in the convective envelope.
Results. We find that the entropy proxy for the solar convective envelope allows us to invalidate adiabatic overshooting as a solution to the solar modelling problem and strongly points towards the need for revised opacities. Our results show that this new indicator is a strong diagnostic of the overall evolution of the thermodynamical conditions at the base of the convective zone.
Conclusions. The new entropy proxy indicator allows for a more accurate characterisation of the conditions at the base of the solar convective zone. While it already allows us to rule out overshooting as a solution to the solar modelling problem, its sensitivity to the shape of the opacity modification and the evolution of the properties at the base of the convective zone makes it a powerful helioseismic diagnostic for solar models.
Key words: Sun: abundances / Sun: fundamental parameters / Sun: helioseismology / Sun: oscillations
© The Authors 2025
 Open Access article, published by EDP Sciences, under the terms of the Creative Commons Attribution License (https://creativecommons.org/licenses/by/4.0), which permits unrestricted use, distribution, and reproduction in any medium, provided the original work is properly cited.
This article is published in open access under the Subscribe to Open model. This email address is being protected from spambots. You need JavaScript enabled to view it. to support open access publication.
1. Introduction
The Sun is a crucial laboratory of stellar physics at microscopic and macroscopic scales and a central reference point for stellar evolution (see Christensen-Dalsgaard 2021, and references therein). Thanks to helioseismic and spectroscopic data, supplemented by the detections of neutrinos, solar modellers have accurate and precise constraints on the internal structure and dynamics of our star (see e.g. Christensen-Dalsgaard et al. 1991, 1996; Basu & Antia 1995, 1997; Schou et al. 1998; Basu et al. 2009; Orebi Gann et al. 2021; Appel et al. 2022, and references therein). A crucial point in the solar structure is the base of the convective zone (BCZ), which is the location of a variety of complex physical phenomena (see Hughes et al. 2007, for a book on the topic) and other works (e.g. Spiegel & Zahn 1992; Garaud 2002; Garaud & Garaud 2008; Acevedo-Arreguin et al. 2013; Strugarek et al. 2023, and references therein). Helioseismology allowed us to locate the radial position at which this transition occurs very precisely; that is, at 0.713 ± 0.001 solar radii (Christensen-Dalsgaard et al. 1991; Basu & Antia 1997). Additional studies have been devoted to study aspects of the thermodynamical properties of the convective envelope itself (Vorontsov et al. 2013, 2014) and its link to the equation of state [see e.g.][]JCD1991Env,JCD1992,Vorontsov1992,Baturin1995,Elliott1996. In this paper, we discuss the properties of the entropy of the convective envelope. As convection is essentially adiabatic in the deep envelope layers, a local measure of the specific entropy should show that it behaves as a constant. This value, as shown by Baturin & Ayukov (1995), is a function of the chemical and thermal stratification at the BCZ. In this work, we built on our previous study (Buldgen et al. 2017a), and here we present a new entropy proxy, its properties, and its link with convective penetration and opacity at the BCZ.
We start by presenting and discussing the equations to derive a new entropy proxy for the solar envelope in Sect. 2, and an inversion of this proxy as a function of normalized radius in the Sun is also presented. The physical information carried by this entropy proxy is then studied in detail in solar calibrated models in Sect. 3, where we discuss the effects of adiabatic overshooting at the BCZ and an opacity increase close to the BCZ on the properties of the entropy proxy in the convective envelope. We then outline the dominant factors influencing the height of the plateau in the convective zone in Sect. 3.3, showing the potential of this quantity to help better constrain the thermodynamical conditions at the BCZ. We also discuss, in Sect. 4, some observed changes in key thermodynamical quantities such as the first adiabatic exponent, the specific heat at constant volume, and the electronic density between the two families of models. We discuss potential future studies and our conclusions in Sect. 5.
2. Entropy proxy in the solar envelope
The stratification in the deep convective envelope of the Sun is almost adiabatic, which motivated Buldgen et al. (2017a) to define a proxy for the entropy, denoted S5/3 = P/ρ5/3 in the convective envelope that was used both for helioseismic and asteroseismic inversions (Buldgen et al. 2017a, 2018; Bétrisey & Buldgen 2022). The equations to derive the kernels for this variable are provided in Buldgen et al. (2017b), and discussions of the behaviour of this physical quantity are also given in Buldgen et al. (2018) and Bétrisey & Buldgen (2022).
One of the key issues of the S5/3 variable is that it takes extreme values at the surface. While this can be mitigated and the inversions remain robust, it is clear that damping these effects is desirable, while maintaining the main property of the indicator, namely the plateau-like behaviour in the convective zone. This is done by defining a new variable, S = P/ρΓ1, which is essentially a refinement of the previous indicator, with Γ1 being the first adiabatic exponent  and 𝒮 the entropy. A comparison between the behaviour of S and S5/3 is illustrated in Fig. 1. Two striking differences can be noted in this profile. First, the amplitude of the variable in the higher convective envelope is much lower. Second, due to the direct use of Γ1 in the expression, a direct trace of helium ionisation in the upper envelope is visible in the profile. These behaviours make this revised indicator far more adapted to probing the solar convective envelope, while the plateau-like behaviour has been fully kept.
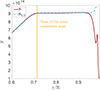 |
Fig. 1. Comparison between two entropy proxies, S and S5/3, showing the divergence of the proxy S5/3 at the surface and the plateau-like behaviour of both proxies in the deep convective layers. |
If we express the variations of entropy using thermodynamic variables, we find that
 (1)
(1)
where we used the following relations
 (2)
(2)
 (3)
(3)
with  ,
,  ,
,  and
and  . This allowed us to rewrite Eq. (1) as
 (4)
(4)
where the first adiabatic exponent is also equal to  . The ideal gas approximation provides χT = χρ = 1 and
  . In the case where γ (or Γ1) is constant, the solution to an adiabatic change, meaning ∫d𝒮 = 0, is the analytical relation
 (5)
(5)
which links our entropy proxy, S, to the thermodynamical entropy, 𝒮, in the regions where Γ1 is a constant. The relation is, however, not valid where Γ1 shows strong variations, such as the helium and hydrogen ionisation zones.
The equations to derive the kernels for the (S, Γ1) structural pair are very similar to the ones for the (S5/3, Γ1) pair and can directly be obtained following the approach of Buldgen et al. (2017b). They are provided below:
![Mathematical equation: $$ \begin{aligned}&y \Gamma _{1}\frac{d^{2}\mathcal{K} }{\mathrm{d}y^{2}} - \left[\left(\frac{m \rho }{2y^{1/2}P} - 2y \frac{\mathrm{d} \Gamma _{1}}{\mathrm{d}y}- \left(3 - \frac{2 \pi \rho y^{3/2}}{m}\right)\right)\Gamma _{1}\right] \frac{\mathrm{d}\mathcal{K} }{\mathrm{d}y}\nonumber \\&-\left[\frac{m}{4y^{1/2}P} \frac{d}{\mathrm{d}x} \left(\frac{\rho }{y^{1/2}}\right) - \frac{1}{4} \frac{d^{2}\Gamma _{1}}{\mathrm{d}y^{2}} + \left(\frac{\rho m}{2y P}\right)^{2} - \left(\frac{5}{2} - \frac{2\pi \rho y^{3/2}}{m}\right) \frac{\mathrm{d}\Gamma _{1}}{\mathrm{d}y}\right]\mathcal{K} \nonumber \\&=-y \frac{d^{2}\mathcal{K} \prime }{\mathrm{d}y^{2}} - \left(3 -\frac{2 \pi \rho y^{3/2}}{m} \right) \frac{\mathrm{d}\mathcal{K} \prime }{\mathrm{d}y}, \nonumber \end{aligned} $$](/articles/aa/full_html/2025/08/aa55366-25/aa55366-25-eq13.gif)
where 𝒦′=Kρ, Γ1n, ℓ, 𝒦 = KS, Γ1n, ℓ, and x = r/R, y = x2. The second kernel of the pair is obtained from the simple relation
 (6)
(6)
The behaviour of the kernels of the (S, Γ1) pair is extremely similar to that of the (S5/3, Γ1) pair; this is due to the intrinsic similarities between S5/3 and S.
An illustration of the inversion for the profile of S in the solar interior for a reference model built with the Grevesse and Noels abundance Grevesse & Noels (1993, GN93) (similarly to Model S in Christensen-Dalsgaard et al. 1996) and a recent standard solar model built with the Asplund et al. (2021, AAG21) abundances is provided in Fig. 2. We also provide, in Appendix A, an example of inversion using artificial data, where we can see that the height of the plateau determined from the inversion is in excellent agreement with the actual model differences. The overall behaviour is very similar to that of S5/3, as illustrated in Buldgen et al. (2017a).
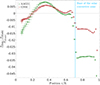 |
Fig. 2. Inversion results for entropy proxy profile, S, as a function of normalised radius for a standard solar model including the current reference photospheric abundances and the ones used in Model S from Christensen-Dalsgaard et al. (1996). |
In Fig. 3, we also illustrate the behaviour of the profile of the entropy proxy itself for both standard solar models and one from a seismic model of Buldgen et al. (2020). This plot illustrates that the observed trend for the entropy proxy is indeed very similar to that observed in Buldgen et al. (2017a); namely, the entropy proxy plateau is too high in standard solar models. This is reminiscent of what is observed in density inversions, although the flat profile observed here is directly due to the physical properties of the convective envelope. In what follows, we discuss the required changes to solar models that may allow us to lower the height of the entropy plateau, following the initial observations made in Buldgen et al. (2019). A first conclusion that can be drawn is that the entropy proxy plateau of models built with the GN93 abundances that were used for Model S in Christensen-Dalsgaard et al. (1996) still have a plateau that is significantly too high. A similar issue with high-metallicity models was already observed in Buldgen et al. (2017a); Buldgen et al. (2019).
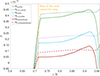 |
Fig. 3. Close comparison between entropy proxies S and S5/3 in the deep convective layers for models including various solar abundances. The same profiles for a seismic model are also provided for comparison. |
In what follows, we describe how we used solar calibrated models computed with the Liège stellar evolution code [CLES;][]ScuflaireCles, using the AAG21 abundances (Asplund et al. 2021), the SAHA-S equation of state (Gryaznov et al. 2004, 2006; Baturin et al. 2017), the OPAL opacity tables (Iglesias & Rogers 1996), the NACRE II nuclear reaction rates (Xu et al. 2013), and the Model-C atmosphere from Vernazza et al. (1981) as standard physical components. The mixing of chemical elements was treated following Thoul et al. (1994) and using the screening coefficients of Paquette et al. (1986), including the effects of partial ionisation. The calibrations were computed using three free parameters: the initial hydrogen and heavy element mass fraction, X0 and Z0, as well as the mixing length parameter of convection, αMLT, while the current solar luminosity, radius, and metallicity were used as constraints.
3. Influence of the BCZ conditions on the position of the plateau
The height of the entropy proxy plateau seems to be highly dependent on the BCZ conditions. As shown in Fig. 3, a change in reference abundances has a direct impact on its position. Similarly, the effects of macroscopic mixing at the BCZ also have a direct effect on the height of the plateau as a result of their impact on the temperature gradients at the BCZ. This is illustrated in Fig. 4. A direct effect of a change in opacity was also observed in Buldgen et al. (2017a), where the use of the OPLIB opacity tables (Colgan et al. 2016) showed a significant improvement in the height of the S5/3 plateau.
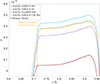 |
Fig. 4. Entropy proxy plateau as a function of normalised radius at the age of the Sun for solar models including the following effects: standard model with reference physics, denoted SAHA-S Std; inclusion of macroscopic mixing at the BCZ, denoted SAHA-S Dt, following Buldgen et al. (2025a); change of the equation of state FreeEOS-Std; change of the modelling of convection in the envelope, denoted SAHA-S CM Std. The entropy proxy profile of a seismic model is provided for comparison. |
While the definition of the new entropy proxy S includes an explicit dependency in Γ1, the observed differences between the Sun and solar models cannot be explained by variations in the equation of state alone. This is also illustrated in Fig. 4, where we plot the profile of S for calibrated solar models computed with the FreeEOS (Irwin 2012) and the SAHA-S equation of state. Significant differences are observed, but still far from what is required to reproduce the seismic value of the entropy proxy. The differences between the two models that were built using the same reference opacities, abundances, and mixing scheme may, however, indicate a strong dependency of the entropy proxy on other thermodynamical variables that differ between the FreeEOS and SAHA-S equations of state. As such, further detailed comparisons between equations of state should still be considered high priority for both solar modelling and opacity computations (Pradhan 2024). Another ingredient of solar models that may influence the height of the entropy proxy plateau is the modelling of convection itself. To assess its impact, we calibrated a solar model using the full spectrum of turbulence depiction of convection from Canuto & Mazzitelli (1991). From Fig. 4, we can see that the variation of the entropy plateau is negligible.
The importance of the entropy of the solar convective envelope has been discussed in previous publications (Buldgen et al. 2017a, 2019), linking it to the solar modelling problem, and earlier works took a deep interest in the entropy of the convective envelope (Baturin & Ayukov 1995). Indeed, it is well known that solar models using the AAG21 abundances still have issues in reproducing the position of the BCZ. In addition, our works have shown that, despite being favoured by helioseismic inversions of the chemical composition of the envelope (Buldgen et al. 2017c, 2024; Baturin et al. 2024), these models cannot naturally reproduce the height of the entropy proxy plateau. In fact, as shown in Fig. 4, if macroscopic mixing is included to actually reproduce the inferred chemical composition of the solar envelope, the situation is significantly worse, both for the BCZ position and the entropy proxy plateau.
Two solutions have been invoked in the literature to replace the BCZ position at the helioseismically inferred location. First, the effects of convective overshooting at the BCZ have been invoked, as one would not expect the mixing-length theory to naturally reproduce the BCZ position of the Sun without any additional mixing [This has been discussed for example in][]Monteiro94,Zhang2019,Baraffe2022. Second, another approach to steepening the temperature gradients on the radiative side of the BCZ is to increase opacity, which has been done in various ad hoc ways in the literature [e.g.][]JCD2009,Ayukov2017,Buldgen2019,Kunitomo2021 and has recently gained more traction thanks to experimental measurements in solar conditions that have revealed disagreements with theoretical computations.
In the following sections, we investigate the behaviour of the entropy proxy plateau under the effects of such modifications and its link with the thermodynamical properties of the BCZ. All models under study use the SAHA-S equation of state, the OPAL opacities, and the AAG21 abundances.
3.1. Impact of overshooting
We start by discussing the effects of adiabatic overshooting at the BCZ. From a helioseismic point of view, it is well known that the temperature gradient transition from the adiabatic gradient to the radiative gradient is located at 0.713 ± 0.001 solar radii. The modelling of the temperature gradient below this limit has been attempted in numerous previous studies (Monteiro et al. 1994; Rempel 2004; Christensen-Dalsgaard et al. 2011; Zhang et al. 2019), the latest of which uses constraints from hydrodynamical simulations. Here, we simply consider the impact of adiabatic overshooting with instantaneous mixing to study the resulting variations of the entropy proxy plateau, irrespective of the actual agreement with helioseismic constraints. We computed a series of calibrated solar models, following a simple standard solar model approach and including increasing values of adiabatic overshooting at the BCZ, αOv, from 0.1HP to 0.65HP, with HP = −dr/dlnP being the local pressure scale height. The properties of these models are summarised in Table 1, where we provide the position, mass coordinate, temperature, density, metallicity (Z), and hydrogen mass fraction (X) at the BCZ. The position provided in Table 1 is that of the transition of the temperature gradients and thus includes the overshooting zone. From a helioseismic point of view, the feature observed in the data is that of the temperature gradient transition, regardless of the fact that it corresponds to the limit provided directly by the mixing length theory or if the mixing region is extended as done in these models.
Global parameters of solar evolutionary models including adiabatic overshooting at the BCZ.
As expected, increasing the amount of adiabatic overshooting leads to a more massive and deeper convective envelope with a higher temperature at the bottom. We can see that the effect on the metallicity of the calibrated solar model is minimal, with a reduction of only 0.0001 in mass fraction between a model replace at the helioseismic position and one pushing it down to 0.67 solar radii. The change in both density an temperature is substantial, of about 40% for the former and 25% for the latter. Despite these large increases, in stark disagreement with helioseismic constraints, we can see in Fig. 5 that the height of the plateau is still not at the helioseismically determined value, which is indicated by the seismic model. The behaviour of the plateau is also relatively regular with respect to overshooting, with a deeper convective envelope systematically leading to a lower plateau.
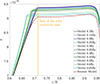 |
Fig. 5. Entropy proxy profile as a function of normalised radius at the age of the Sun for the models of Table 1. The entropy proxy profile of a seismic model is also provided for comparison. |
This demonstrates that overshooting is not efficient enough in decreasing the entropy proxy value in the convective envelope and cannot be invoked as the sole solution to the existing discrepancies in solar models. This is further confirmed by recent modelling efforts based on hydrodynamical simulation (Baraffe et al. 2022), which limit the region affected by convective elements to a very narrow layer. This does not mean that overshooting does not have an effect in solar models, but rather that its effect cannot be invoked to explain the height of the entropy proxy plateau. In Fig. 6, we illustrate the evolution during the main sequence of the position of the convective-envelope base and the height of the entropy proxy plateau at the BCZ during the evolution of our solar models with αOv > 0.3HP. As can be seen, the behaviour is extremely regular, the BCZ position as a function of time is simply pushed deeper by the overshooting parameter, and the height of the plateau is thus lowered throughout the evolution on the main sequence. We can also see that while the position of the BCZ deepens during the main sequence, the entropy plateau rises over time, indicating that there is indeed an independent constraint brought by the entropy proxy from the BCZ position itself. Indeed, the behaviour of the entropy proxy seems more in line with the evolution of the mass coordinate of the BCZ that increases with time as the convective envelope becomes deeper during the main sequence, but the temperature at the BCZ decreases. However, we see in Sect. 3.2 that the entropy proxy still provides additional insight into the mass coordinate of the BCZ, meaning that it may serve as an additional diagnostic of the properties of the solar convective envelope.
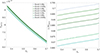 |
Fig. 6. Evolution of height of entropy proxy plateau at the BCZ and of the depth of the BCZ as a function of central hydrogen mass fraction for the models of Table 1. Left panel: Evolution of height of the entropy proxy plateau, S(cz). Right panel: Evolution of position of the BCZ. |
3.2. Impact of an opacity increase
The other way to steepen temperature gradients at the BCZ and affect the entropy proxy plateau in the envelope is by increasing the opacity on the radiative side of the border. This was already observed in Buldgen et al. (2019), while the importance of opacity was already seen in Buldgen et al. (2017a). However, these studies did not investigate the underlying physical mechanism leading to the variations of the height of the entropy proxy plateau. For example, while it was clearly seen that the amplitude of the opacity increase had an impact on the entropy proxy, it is also clear that the exact functional form of the increase and its dependency with evolution will have a clear impact on the final properties of the solar models.
To draw a more detailed picture of the influence of the opacity profile on the height of the entropy plateau while keeping a limited number of free parameters, we describe the opacity increase using a simple Gaussian formula, which is localised around a single temperature as in previous works [e.g.][]Ayukov2017,Buldgen2019,Kunitomo2021. This increase was motivated by experimental results (Bailey et al. 2015), indicating a significant discrepancy in iron opacity in BCZ conditions; it is, however, by no means an accurate depiction of the physical explanation behind the experimental and theoretical opacities, but it will help us understand the behaviour of the entropy proxy plateau and what parameters influence its position at the solar age. Similarly, we note that systematic differences have also been observed for nickel and chromium (Nagayama et al. 2019), although at a much more moderate level, and that recent work points towards potential issues with oxygen (Mayes et al. 2025).
The opacity increase is thus simply described as
 (7)
(7)
with κ′ being the modified opacity, κ the reference opacity from the table used in the model, and δ the parametrised increase,
 (8)
(8)
with A, log Tref, and σ being free parameters in our framework. A = x, implying an x% increase of the mean Rosseland opacity derived from the tables. We therefore tested various values for these parameters to see which ones impact the height of the entropy proxy plateau and the thermodynamical conditions at the BCZ. We use the following naming conventions for the models including this opacity increase: Model A − σ − log Tref. We present out test cases in Table 2, where we consider relatively small, 1% in peak amplitude variations, 100 in σ ones, and 0.01 in log T ones.
Global parameters of solar evolutionary models including an ad hoc opacity increase at the BCZ.
All these models also include a calibrated macroscopic mixing coefficient parametrised as a density power law as in Proffitt & Michaud (1991). They were computed following the approach of Buldgen et al. (2025a) in order to reproduce the observed lithium and beryllium depletion at the age of the Sun (Wang et al. 2021; Amarsi et al. 2024). The effects of macroscopic mixing can be seen from their significantly lower hydrogen mass fraction in the convective envelope in Table 2 compared to the values found in the models that only include overshooting in Table 1.
In Fig. 7, we present the impact of the opacity modification on the height of the entropy plateau. The first conclusion we can draw from looking at Fig. 7 and Table 2 is that the opacity modification makes it possible to alter the height of the entropy plateau very efficiently without significantly changing global parameters such as (r/R)BCZ, ρBCZ, or even TBCZ. This is in stark contrast with the effects of adiabatic overshooting that significantly alter the BCZ properties and require unreasonable values to actually lead to a low enough entropy plateau. Looking at the effect of opacity and the equation of state illustrated in Fig. 4, we can see that these are much more promising avenues to reproduce the entropy proxy plateau in solar models.
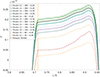 |
Fig. 7. Entropy proxy profile as a function of normalised radius at the age of the Sun for the models of Table 2. The entropy proxy profile of a seismic model is also provided for comparison. |
Unlike the effects of overshooting, there is also no correlation between the depth of the convective zone and the height of the entropy plateau as the model evolves. This is confirmed by looking at Fig. 8, which plots, in parallel, the evolution of the entropy plateau height at the BCZ and the position of the BCZ as a function of central hydrogen. Again, the evolution is very smooth, with the height of the plateau evolving regularly as the model burns hydrogen. The plateau rises over time as the BCZ position evolves inwards.
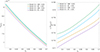 |
Fig. 8. Evolution of height of entropy proxy plateau at BCZ and of the depth of the BCZ as a function of central hydrogen mass fraction for three representative models of Table 2. Left panel: Evolution of height of entropy proxy plateau, S(cz). Right panel: Evolution of position of the BCZ. |
From a more detailed investigation of the height of the plateau and its link with the opacity increase, we can see that increasing the amplitude, A, the width, σ, or the reference temperature at which the increase occurs, log Tref, allows us to push the entropy plateau down. It seems that increasing A is also directly linked with a lower BCZ position, whereas the width of the opacity modification has a more efficient impact on the height of the plateau.
However, these effects are clearly non-linear and correlated; for example, changing the reference temperature of a narrow opacity increase only has a minor impact, whereas changing the amplitude of a broader opacity peak by only 1% can shift the plateau significantly downwards. The situation is thus much more complex than for adiabatic overshooting, and it would not really be useful to attempt to precisely parametrise the required functional shape of the opacity modification that would lead to the correct height of the entropy plateau at the age of the Sun.
3.3. Origins of the variations of the entropy proxy plateau
The results presented in Sects. 3.1 and 3.2 show that the entropy proxy plateau may be influenced by both adiabatic overshooting and an opacity increase. However, adiabatic overshooting leads to solutions in complete disagreement with helioseismic constraints, and it seems impossible to induce a readjustment of the entropy plateau as low as the value found by seismic models on the sole basis of an extension of the adiabatic layers in the deep convective envelope. The situation is the opposite for the opacity increase, for which large readjustments of the height of the entropy plateau can be obtained without being in conflict with the position of the BCZ. Using the definition of the entropy proxy and assuming the perfect gas equation, which is valid at the base of the convective zone, we can identify the contributing factors to its height:
 (9)
(9)
The first factor is temperature, with a lower temperature leading to a lower entropy plateau. This is quite difficult to achieve as the temperature of the BCZ is directly linked with the depth of the BCZ. As can be seen from Table 2, a given (r/R)BCZ leads almost exactly to a given TBCZ (and a given (m/M)BCZ). Reducing the temperature at the BCZ would require pushing it outwards and go against the precise helioseismic determination of its location. Another option is to increase the mean molecular weight in the CZ. This quantity is, however, directly fixed by spectroscopic and helioseismic constraints. There is therefore little room for manoeuvre for a given set of constraints, especially if one considers light element depletion (Buldgen et al. 2025a).
The mean molecular weight also has a more intricate effect. For example, one might argue that a standard solar model using a high metallicity value produces a better entropy proxy plateau height than a model using the AAG21 abundances, as can be seen from Fig. 1, and that this property therefore validates a high metallicity in the solar envelope. This is incorrect, as, for example, the AAG21 model including macroscopic mixing has almost the same mean molecular weight in the CZ as a GN93 model; this is because it has almost the same helium-mass fraction in the CZ, but its entropy proxy plateau is significantly worse. This is due to its shallower convective zone that leads to a significantly lower density at the BCZ and thus a lower plateau. The better performance of a high-metallicity SSM is not a result of the mean molecular weight value, but rather of the intrinsically larger opacity close to the BCZ that results from the higher metallicity. Mixing to reproduce the lithium depletion in such a model would lead to a worsening of the agreement of the entropy proxy plateau, while a significant variation is still required in order to agree with the seismically determined value. It would therefore be incorrect to use an entropy proxy inversion to validate the abundances, similarly to using a sound-speed inversion to that end. The influence of the mean molecular weight implies, however, that changes may be observed if the conditions of a solar evolutionary model at the ZAMS are altered, such as the efficiency of nuclear reactions, the opacity at high temperatures, or the effects of planetary accretion. Such effects would need to be investigated in detail in the future.
The last quantity in Eq. (9) that may impact the entropy proxy plateau is the density in the CZ. This is again directly seen in Table 2: the model with the lowest entropy plateau in Fig. 7 also has the highest density at the CZ. The same remains true for the models including overshooting in Table 1, but in the case of overshooting, the higher density is accompanied by a significantly higher temperature (since the CZ is pushed inwards), which reduces the efficiency with which the entropy proxy plateau can be lowered. To understand what is happening, it is interesting to look at the temperature and density variations between the various models. In Fig. 9, we plot the relative differences in temperature and density between Model 0.1HP and Model 0.65HP for the overshooting models and Model 14 − 480 − 6.35, and both Model 15 − 80 − 6.36 and Model 15 − 35 − 6.36 for the modified opacity models as a function of the radius normalised at the BCZ. This means that the upper limit of the plot is the BCZ and that the differences are renormalised so that the extent of the plateau is the same in both models. This choice ensured that the comparisons were made at the same relative distance with respect to the convective envelope.
From Fig. 9, we can confirm that the differences in temperature and density are larger by an order of magnitude in the case of overshooting. The increase in density is of 49%, which alone would be sufficient to drastically reduce the height of the entropy proxy plateau. It is, however, accompanied by an increase in temperature by about 26%, which, as seen in Eq. (9), compensates for the density increase. All in all, if we estimate the change in the value of S from these changes, we should see a decrease between Model 0.65HP and Model 0.1HP for the value of S at the BCZ of about 3%, which is exactly what is seen from Fig. 5.
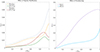 |
Fig. 9. Relative differences in density and temperature as a function of the radius normalised at the position of the BCZ. Left panel: Effect of an opacity modification, as seen between Model 14 − 480 − 6.35, Model 15 − 35 − 6.36, and Model 15 − 80 − 6.35. Right panel: Effect of overshooting, as seen between Model 0.65HP and Model 0.1HP. |
If we look at the differences induced by an opacity modification, we can see that the density is changed by about 3%, while the temperature only changes by 1%. Again using Eq. (9), the induced modification on the entropy proxy plateau is of about 1%, which is confirmed in Fig. 7. The same effect is observed for Model 15 − 35 − 6.36, with the temperature and density modifications having essentially the same shape as for Model 15 − 80 − 6.36, but a wider extension and a larger amplitude. This confirms that the increase in density at the BCZ required to lower the height of the entropy proxy plateau must be generated by a physical mechanism that does not significantly affect temperature. In a more quantitative way, if δρ/ρ is the relative change in density, we simply have δT/T < (Γ1 − 1)δρ/ρ. While both physical processes here satisfy this rule, overshooting is accompanied by two main drawbacks. First, it must keep a sharp temperature-gradient transition located at 0.713 R⊙. Second, it must not induce a too high depletion of lithium at the solar age. Model 0.65HP is in total contradiction with both these constraints, and, given the large variations in density, it likely does not lead to an adequate reproduction of the solar sound-speed profile, while an opacity modification has been shown on numerous occasions to improve the agreement of models with helioseismic data. This again confirms that overshooting alone cannot reproduce the height of the entropy proxy plateau in the Sun.
4. Additional thermodynamic quantities
In addition to looking at the main driving factors of the height of the entropy proxy plateau, it is also interesting to consider the behaviour of other thermodynamic quantities that are directly impacted by these model changes. In Fig. 10, we illustrate in the left panel the Γ1 profile of the standard solar model, Model 15 − 80 − 6.35 and Model 0.65HP, and in the right panel the CV profile for the same models. Again, the profiles for CV are quite different, especially in the convective envelope, as a result of the difference XCZ in the value of CV in the convective envelope. Indeed, we added macroscopic mixing in the models including an opacity modification, which leads to a lower value of XCZ compared to the models with overshooting, as can be seen from Tables 1 and 2. The higher XCZ value in the models including macroscopic transport leads to a much lower value of CV in the convective zone.
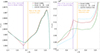 |
Fig. 10. Left panel: First adiabatic exponent, Γ1, as a function of normalised radius for an SSM, Model 0.65HP, and Model 15 − 80 − 6.35. Right panel: Specific heat at constant volume CV as a function of normalised radius for an SSM, Model 0.65HP, and Model 15 − 80 − 6.35. |
The variations in Γ1 induced by the change in opacity at the BCZ are very small, which implies a relatively small variation of the ion fractions at the BCZ, whereas the change induced by overshooting is much more extreme and leads to a clear dip in Γ1 that would create a very clear signature. The small modification of ion populations is confirmed when looking at the relative differences in electronic density, ne, between Model 14 − 480 − 6.35 and Model 15 − 80 − 6.35; this is illustrated in Fig. 11. We note an increase of about 1% in the electronic density close to the CZ that directly follows the change in density.
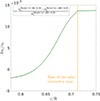 |
Fig. 11. Relative differences in electronic density between Model 14 − 480 − 6.35 and Model 15 − 80 − 6.35 as a function of normalised radius. |
Such a variation remains small, but is still significant at the level of precision required by helioseismic constraints. Moreover, it is to be noted that the evolution during the main sequence of the electronic density at the BCZ is far larger than the evolution of the temperature of the BCZ over the same period. Therefore, it might explain why a parametrisation of opacity based on temperature alone will not capture the full evolutionary trends at the BCZ. On the other hand, adding a dependency on electronic density in an opacity correction requires a better understanding of its overall effect and ideally a guess of the physical origins of such a dependency.
5. Conclusion
In this study, we introduced an updated formulation of the entropy proxy indicator defined in Buldgen et al. (2017a). We started by introducing the definition of the indicator, its link with entropy, and the differential equations to derive the structural kernels to carry out helioseismic inversions in Sect. 2. We then studied the diagnostic potential of the indicator and its link to the two main modelling components influencing its height in the convective envelope, namely convective overshooting at the BCZ and an opacity increase at the BCZ, which is discussed in detail in Sect. 3. We also discuss the link between the behaviour of this entropy plateau during the main sequence and key quantities such as the position, density, and temperature at the BCZ. We find that we can strongly differentiate between the effects of overshooting and an opacity increase at the BCZ, concluding that the former cannot be invoked to solve the solar modelling problem linked with the revised abundances of Asplund et al. (2021). The behaviour of the entropy proxy plateau in the CZ, coupled with the precise determination of the position of the BCZ in the Sun, leaves an opacity increase as the prime candidate for reducing the observed discrepancies. The exact magnitude and extent of that increase will be impacted by other physical elements such as the equation of state or the nuclear reaction rates that may alter the calibrated solar parameters such as its initial hydrogen mass or heavy element mass fraction. Our tests using the currently available physical inputs (see Fig. 4) show that the equation of state and the modelling of convection available in CLES have little impact, but this only remains valid for the tested elements1. In this context, further work is needed to investigate the development of a comprehensive framework including the height of the entropy plateau in an extended calibration scheme. This, however, requires more detailed investigations.
In Sect. 3.3, we discuss the dominant factors that may influence the behaviour of the entropy proxy plateau. We highlight the fact that, for a given mean molecular weight, the density and temperature modifications must obey a simple proportionality law to allow for the height of the plateau to be lowered. This puts constraints on the physical mechanism that may allow us to lower the entropy plateau in solar evolutionary models and confirms that overshooting is not a prime candidate to correct solar evolutionary models, as the modifications induced in the radiative zone are extreme.
In Sect. 4, we consider other thermodynamical quantities such as the specific heat, the first adiabatic exponent, and the electronic density in more detail. We find that opacity modifications lead to small variations of electronic density that closely follow the density modifications. The changes induced in the specific heat profile and Γ1 profile indicate that the overall modifications induced by the opacity modifications are relatively few, albeit significant. A better understanding of the impact of such changes and their response to revision of physical processes entering the computation of opacities might be key to explaining the current discrepancies between theoretical opacity computations, experimental measurements, and helioseismic determinations of the solar radiative opacity (Buldgen et al. 2025b).
Our investigation highlights the diagnostic potential of the entropy proxy indicator to unravel the evolution of the BCZ condition on the main sequence. Coupled to a detailed chemical evolution based on light element depletion [following e.g.][]Richard1996,Richard1997,Brun2002,Buldgen2025Be, further analyses of the behaviour of specific heat at the BCZ and of the evolution of the entropy proxy plateau may help us better understand the necessary behaviour and dominant factors in the required opacity modifications. So far, we have only investigated the effects of modifications parametrised on temperature, while electronic density also plays a key role in influencing opacity. In this respect, the fact that the entropy proxy plateau might act as a key constraint to understanding the shape of opacity corrections that would allow us to replace its height at the seismic value and potentially help pinpoint missing physical processes in current opacity computations.
Evolutionary computations by Kunitomo & Guillot (2021) and Kunitomo et al. (2022) have already shown that a wider Gaussian provided good agreement in terms of sound speed. As demonstrated here, the entropy proxy plateau provides an independent diagnostic that allows us to further characterise the shape, position, and amplitude of an opacity modification. By linking it to microphysical ingredients of solar models at the BCZ, this diagnostic allows us to efficiently complement Ledoux’s discriminant inversions (Buldgen et al. 2017d), which have been used to infer the required opacity modification at the current solar age (Buldgen et al. 2025b). With this additional helioseismic diagnostic and revised chemical transport prescriptions anchored in recent observations (Wang et al. 2021; Amarsi et al. 2024), we may provide a helioseismic diagnostic to complement experimental measurements that are pointing to further inaccuracies between opacity computations (Bailey et al. 2015; Nagayama et al. 2019; Mayes et al. 2025).
A similar effect can be expected for changing the nuclear reaction rates within the tests carried out in Buldgen et al. (2019).
Acknowledgments
We thank the referee for their careful reading of the manuscript. GB acknowledges fundings from the Fonds National de la Recherche Scientifique (FNRS) as a postdoctoral researcher. The study by V.A.B., A.V.O., S.V.A. was conducted under the state assignment of Lomonosov Moscow State University.
References
- Acevedo-Arreguin, L. A., Garaud, P., & Wood, T. S. 2013, MNRAS, 434, 720 [Google Scholar]
- Amarsi, A. M., Ogneva, D., Buldgen, G., et al. 2024, A&A, 690, A128 [NASA ADS] [CrossRef] [EDP Sciences] [Google Scholar]
- Appel, S., Bagdasarian, Z., Basilico, D., et al. 2022, Phys. Rev. Lett., 129, 252701 [NASA ADS] [CrossRef] [Google Scholar]
- Asplund, M., Amarsi, A. M., & Grevesse, N. 2021, A&A, 653, A141 [NASA ADS] [CrossRef] [EDP Sciences] [Google Scholar]
- Ayukov, S. V., & Baturin, V. A. 2017, Astron. Rep., 61, 901 [NASA ADS] [CrossRef] [Google Scholar]
- Bailey, J. E., Nagayama, T., Loisel, G. P., et al. 2015, Nature, 517, 3 [Google Scholar]
- Baraffe, I., Constantino, T., Clarke, J., et al. 2022, A&A, 659, A53 [NASA ADS] [CrossRef] [EDP Sciences] [Google Scholar]
- Basu, S., & Antia, H. M. 1995, MNRAS, 276, 1402 [NASA ADS] [Google Scholar]
- Basu, S., & Antia, H. M. 1997, MNRAS, 287, 189 [NASA ADS] [CrossRef] [Google Scholar]
- Basu, S., Chaplin, W. J., Elsworth, Y., New, R., & Serenelli, A. M. 2009, ApJ, 699, 1403 [NASA ADS] [CrossRef] [Google Scholar]
- Baturin, V. A., & Ayukov, S. V. 1995, AZh, 72, 549 [Google Scholar]
- Baturin, V. A., Däppen, W., Morel, P., et al. 2017, A&A, 606, A129 [NASA ADS] [CrossRef] [EDP Sciences] [Google Scholar]
- Baturin, V. A., Oreshina, A. V., Buldgen, G., et al. 2024, Sol. Phys., 299, 142 [Google Scholar]
- Bétrisey, J., & Buldgen, G. 2022, A&A, 663, A92 [NASA ADS] [CrossRef] [EDP Sciences] [Google Scholar]
- Brun, A. S., Antia, H. M., Chitre, S. M., & Zahn, J. P. 2002, A&A, 391, 725 [NASA ADS] [CrossRef] [EDP Sciences] [Google Scholar]
- Buldgen, G., Salmon, S. J. A. J., Noels, A., et al. 2017a, A&A, 607, A58 [NASA ADS] [CrossRef] [EDP Sciences] [Google Scholar]
- Buldgen, G., Reese, D. R., & Dupret, M. A. 2017b, A&A, 598, A21 [NASA ADS] [CrossRef] [EDP Sciences] [Google Scholar]
- Buldgen, G., Salmon, S. J. A. J., Noels, A., et al. 2017c, MNRAS, 472, 751 [NASA ADS] [CrossRef] [Google Scholar]
- Buldgen, G., Salmon, S. J. A. J., Godart, M., et al. 2017d, MNRAS, 472, L70 [NASA ADS] [CrossRef] [Google Scholar]
- Buldgen, G., Reese, D. R., & Dupret, M. A. 2018, A&A, 609, A95 [NASA ADS] [CrossRef] [EDP Sciences] [Google Scholar]
- Buldgen, G., Salmon, S. J. A. J., Noels, A., et al. 2019, A&A, 621, A33 [NASA ADS] [CrossRef] [EDP Sciences] [Google Scholar]
- Buldgen, G., Eggenberger, P., Baturin, V. A., et al. 2020, A&A, 642, A36 [EDP Sciences] [Google Scholar]
- Buldgen, G., Noels, A., Baturin, V. A., et al. 2024, A&A, 681, A57 [NASA ADS] [CrossRef] [EDP Sciences] [Google Scholar]
- Buldgen, G., Noels, A., Amarsi, A. M., et al. 2025a, A&A, 694, A285 [NASA ADS] [CrossRef] [EDP Sciences] [Google Scholar]
- Buldgen, G., Pain, J.-C., Cossé, P., et al. 2025b, Nat. Commun., 16, 693 [Google Scholar]
- Canuto, V. M., & Mazzitelli, I. 1991, ApJ, 370, 295 [NASA ADS] [CrossRef] [Google Scholar]
- Christensen-Dalsgaard, J. 2021, Liv. Rev. Sol. Phys., 18, 2 [NASA ADS] [CrossRef] [Google Scholar]
- Christensen-Dalsgaard, J., & Däppen, W. 1992, A&ARv, 4, 267 [NASA ADS] [CrossRef] [Google Scholar]
- Christensen-Dalsgaard, J., & Pérez Hernández, F. 1991, in Challenges to Theories of the Structure of Moderate-Mass Stars, eds. D. Gough, & J. Toomre, 388, 43 [Google Scholar]
- Christensen-Dalsgaard, J., Gough, D. O., & Thompson, M. J. 1991, ApJ, 378, 413 [NASA ADS] [CrossRef] [Google Scholar]
- Christensen-Dalsgaard, J., Dappen, W., Ajukov, S. V., et al. 1996, Science, 272, 1286 [Google Scholar]
- Christensen-Dalsgaard, J., di Mauro, M. P., Houdek, G., & Pijpers, F. 2009, A&A, 494, 205 [NASA ADS] [CrossRef] [EDP Sciences] [Google Scholar]
- Christensen-Dalsgaard, J., Monteiro, M. J. P. F. G., Rempel, M., & Thompson, M. J. 2011, MNRAS, 414, 1158 [CrossRef] [Google Scholar]
- Colgan, J., Kilcrease, D. P., Magee, N. H., et al. 2016, ApJ, 817, 116 [Google Scholar]
- Corbard, T., Blanc-Féraud, L., Berthomieu, G., & Provost, J. 1999, A&A, 344, 696 [NASA ADS] [Google Scholar]
- Elliott, J. R. 1996, MNRAS, 280, 1244 [NASA ADS] [CrossRef] [Google Scholar]
- Garaud, P. 2002, MNRAS, 329, 1 [NASA ADS] [CrossRef] [Google Scholar]
- Garaud, P., & Garaud, J. D. 2008, MNRAS, 391, 1239 [NASA ADS] [CrossRef] [Google Scholar]
- Grevesse, N., & Noels, A. 1993, in Origin and Evolution of the Elements, eds. N. Prantzos, E. Vangioni-Flam, & M. Casse, 15 [Google Scholar]
- Gryaznov, V. K., Ayukov, S. V., Baturin, V. A., et al. 2004, AIP Conf. Ser., 731, 147 [NASA ADS] [CrossRef] [Google Scholar]
- Gryaznov, V. K., Ayukov, S. V., Baturin, V. A., et al. 2006, J. Phys. A: Math. Gen., 39, 4459 [NASA ADS] [CrossRef] [Google Scholar]
- Hughes, D. W., Rosner, R., & Weiss, N. O. 2007, The Solar Tachocline (Cambridge: Cambridge University Press) [Google Scholar]
- Iglesias, C. A., & Rogers, F. J. 1996, ApJ, 464, 943 [NASA ADS] [CrossRef] [Google Scholar]
- Irwin, A. W. 2012, Astrophysics Source Code Library [record ascl:1211.002] [Google Scholar]
- Kunitomo, M., & Guillot, T. 2021, A&A, 655, A51 [NASA ADS] [CrossRef] [EDP Sciences] [Google Scholar]
- Kunitomo, M., Guillot, T., & Buldgen, G. 2022, A&A, 667, L2 [NASA ADS] [CrossRef] [EDP Sciences] [Google Scholar]
- Mayes, D., Hobbs, B., Heeter, R., et al. 2025, High Energy Density Phys., 55, 101177 [Google Scholar]
- Monteiro, M. J. P. F. G., Christensen-Dalsgaard, J., & Thompson, M. J. 1994, A&A, 283, 247 [NASA ADS] [Google Scholar]
- Nagayama, T., Bailey, J. E., Loisel, G. P., et al. 2019, Phys. Rev. Lett., 122, 235001 [Google Scholar]
- Orebi Gann, G. D., Zuber, K., Bemmerer, D., & Serenelli, A. 2021, Annu. Rev. Nucl. Part. Sci., 71, 491 [CrossRef] [Google Scholar]
- Paquette, C., Pelletier, C., Fontaine, G., & Michaud, G. 1986, ApJS, 61, 177 [Google Scholar]
- Pradhan, A. K. 2024, MNRAS, 527, L179 [Google Scholar]
- Proffitt, C. R., & Michaud, G. 1991, ApJ, 380, 238 [Google Scholar]
- Rempel, M. 2004, ApJ, 607, 1046 [Google Scholar]
- Richard, O., & Vauclair, S. 1997, A&A, 322, 671 [Google Scholar]
- Richard, O., Vauclair, S., Charbonnel, C., & Dziembowski, W. A. 1996, A&A, 312, 1000 [NASA ADS] [Google Scholar]
- Schou, J., Antia, H. M., Basu, S., et al. 1998, ApJ, 505, 390 [Google Scholar]
- Scuflaire, R., Théado, S., Montalbán, J., et al. 2008, Ap&SS, 316, 83 [Google Scholar]
- Spiegel, E. A., & Zahn, J. P. 1992, A&A, 265, 106 [NASA ADS] [Google Scholar]
- Strugarek, A., Belucz, B., Brun, A. S., Dikpati, M., & Guerrero, G. 2023, Space Sci. Rev., 219, 87 [NASA ADS] [CrossRef] [Google Scholar]
- Thoul, A. A., Bahcall, J. N., & Loeb, A. 1994, ApJ, 421, 828 [Google Scholar]
- Vernazza, J. E., Avrett, E. H., & Loeser, R. 1981, ApJS, 45, 635 [Google Scholar]
- Vorontsov, S. V., Baturin, V. A., & Pamiatnykh, A. A. 1992, MNRAS, 257, 32 [NASA ADS] [CrossRef] [Google Scholar]
- Vorontsov, S. V., Baturin, V. A., Ayukov, S. V., & Gryaznov, V. K. 2013, MNRAS, 430, 1636 [Google Scholar]
- Vorontsov, S. V., Baturin, V. A., Ayukov, S. V., & Gryaznov, V. K. 2014, MNRAS, 441, 3296 [NASA ADS] [CrossRef] [Google Scholar]
- Wang, E. X., Nordlander, T., Asplund, M., et al. 2021, MNRAS, 500, 2159 [Google Scholar]
- Xu, Y., Takahashi, K., Goriely, S., et al. 2013, Nucl. Phys. A, 918, 61 [Google Scholar]
- Zhang, Q.-S., Li, Y., & Christensen-Dalsgaard, J. 2019, ApJ, 881, 103 [Google Scholar]
Appendix A: Additional figures
We illustrate in Fig. A.1 an inversion exercise on artificial data for the entropy proxy indicator S. The inversion accurately reproduces the height of the plateau and the overall features of the profile, while some degree of resolution limitation can be seen in the tachocline region. It is likely that non-linear RLS methods (Corbard et al. 1999) will be required to fully resolve the profile in these layers.
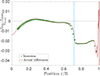 |
Fig. A.1. Example of inversion for the entropy proxy S using artificial data, using an AAG21 SSM model as reference and a GN93 SSM as target. |
All Tables
Global parameters of solar evolutionary models including adiabatic overshooting at the BCZ.
Global parameters of solar evolutionary models including an ad hoc opacity increase at the BCZ.
All Figures
|
Fig. 1. Comparison between two entropy proxies, S and S5/3, showing the divergence of the proxy S5/3 at the surface and the plateau-like behaviour of both proxies in the deep convective layers. |
| In the text | |
|
Fig. 2. Inversion results for entropy proxy profile, S, as a function of normalised radius for a standard solar model including the current reference photospheric abundances and the ones used in Model S from Christensen-Dalsgaard et al. (1996). |
| In the text | |
|
Fig. 3. Close comparison between entropy proxies S and S5/3 in the deep convective layers for models including various solar abundances. The same profiles for a seismic model are also provided for comparison. |
| In the text | |
|
Fig. 4. Entropy proxy plateau as a function of normalised radius at the age of the Sun for solar models including the following effects: standard model with reference physics, denoted SAHA-S Std; inclusion of macroscopic mixing at the BCZ, denoted SAHA-S Dt, following Buldgen et al. (2025a); change of the equation of state FreeEOS-Std; change of the modelling of convection in the envelope, denoted SAHA-S CM Std. The entropy proxy profile of a seismic model is provided for comparison. |
| In the text | |
|
Fig. 5. Entropy proxy profile as a function of normalised radius at the age of the Sun for the models of Table 1. The entropy proxy profile of a seismic model is also provided for comparison. |
| In the text | |
|
Fig. 6. Evolution of height of entropy proxy plateau at the BCZ and of the depth of the BCZ as a function of central hydrogen mass fraction for the models of Table 1. Left panel: Evolution of height of the entropy proxy plateau, S(cz). Right panel: Evolution of position of the BCZ. |
| In the text | |
|
Fig. 7. Entropy proxy profile as a function of normalised radius at the age of the Sun for the models of Table 2. The entropy proxy profile of a seismic model is also provided for comparison. |
| In the text | |
|
Fig. 8. Evolution of height of entropy proxy plateau at BCZ and of the depth of the BCZ as a function of central hydrogen mass fraction for three representative models of Table 2. Left panel: Evolution of height of entropy proxy plateau, S(cz). Right panel: Evolution of position of the BCZ. |
| In the text | |
|
Fig. 9. Relative differences in density and temperature as a function of the radius normalised at the position of the BCZ. Left panel: Effect of an opacity modification, as seen between Model 14 − 480 − 6.35, Model 15 − 35 − 6.36, and Model 15 − 80 − 6.35. Right panel: Effect of overshooting, as seen between Model 0.65HP and Model 0.1HP. |
| In the text | |
|
Fig. 10. Left panel: First adiabatic exponent, Γ1, as a function of normalised radius for an SSM, Model 0.65HP, and Model 15 − 80 − 6.35. Right panel: Specific heat at constant volume CV as a function of normalised radius for an SSM, Model 0.65HP, and Model 15 − 80 − 6.35. |
| In the text | |
|
Fig. 11. Relative differences in electronic density between Model 14 − 480 − 6.35 and Model 15 − 80 − 6.35 as a function of normalised radius. |
| In the text | |
|
Fig. A.1. Example of inversion for the entropy proxy S using artificial data, using an AAG21 SSM model as reference and a GN93 SSM as target. |
| In the text | |
Current usage metrics show cumulative count of Article Views (full-text article views including HTML views, PDF and ePub downloads, according to the available data) and Abstracts Views on Vision4Press platform.
Data correspond to usage on the plateform after 2015. The current usage metrics is available 48-96 hours after online publication and is updated daily on week days.
Initial download of the metrics may take a while.