Open Access
Fig. 1.
Download original image
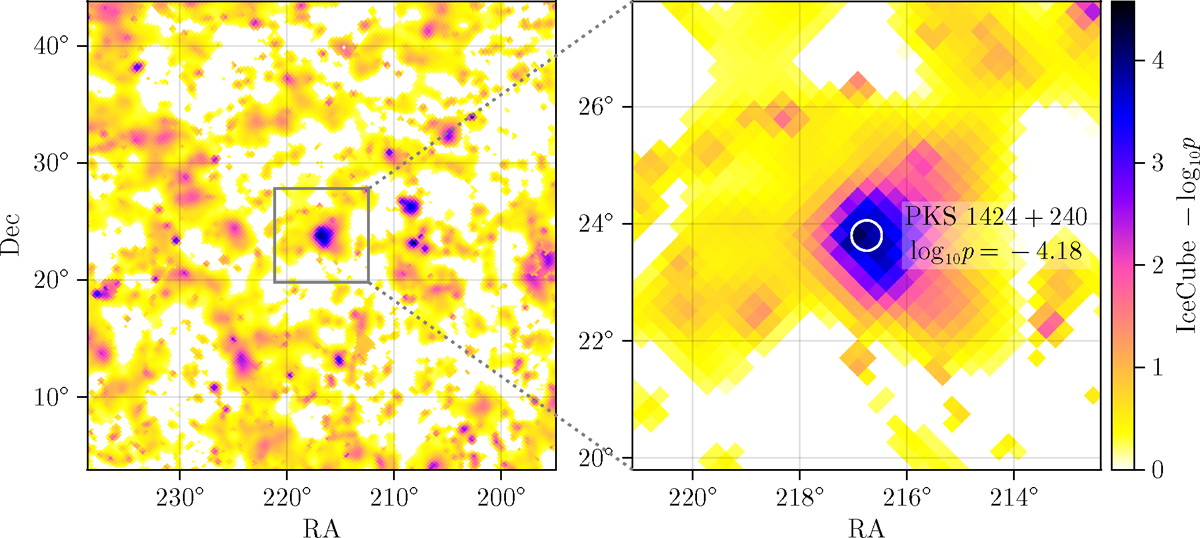
IceCube skymap cutout surrounding the radio position of the PKS 1424+240 blazar. The color scale represents the local p-value from the 9-year maximum likelihood analysis performed by Abbasi et al. (2022).
Current usage metrics show cumulative count of Article Views (full-text article views including HTML views, PDF and ePub downloads, according to the available data) and Abstracts Views on Vision4Press platform.
Data correspond to usage on the plateform after 2015. The current usage metrics is available 48-96 hours after online publication and is updated daily on week days.
Initial download of the metrics may take a while.