Fig. 2.
Download original image
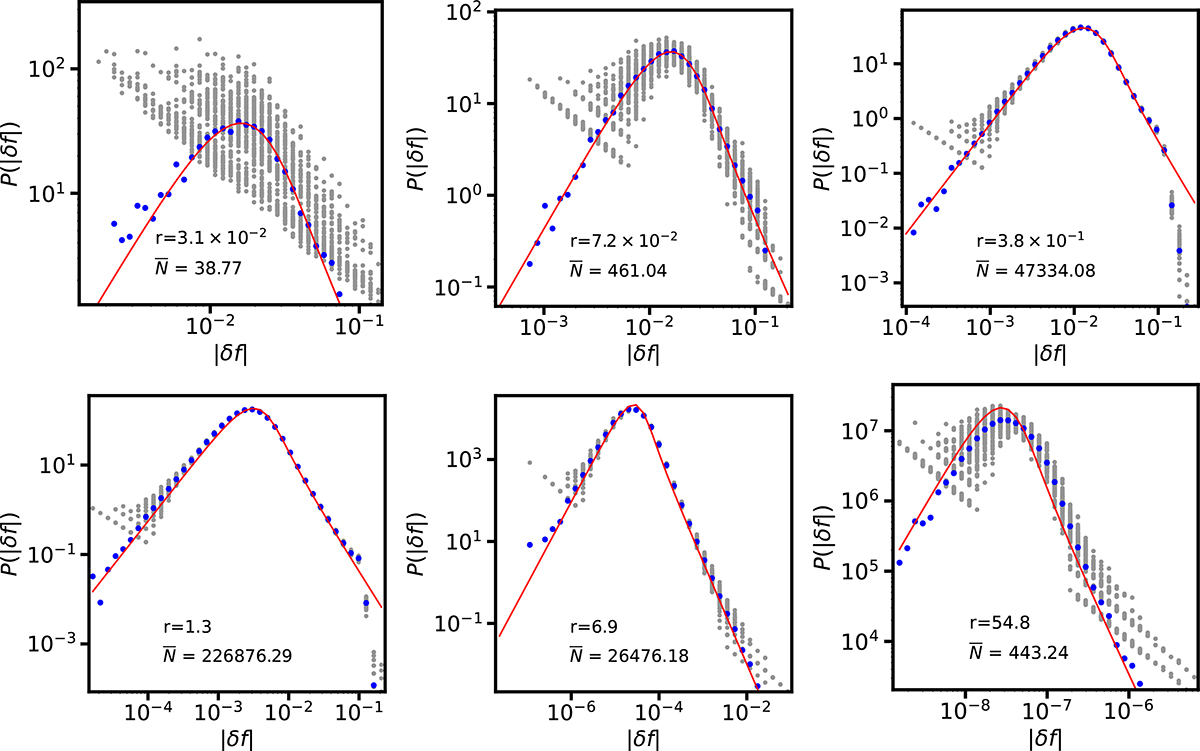
Numerically evaluated distribution of force fluctuation, 𝒫(δf), in different shells of increasing radius (clockwise from top left, r = 3.1 × 10⁻², 7.2 × 10⁻², 0.38, 1.3, 6.9, and 54.8 in units of rc) for a Plummer model with N = 106 and 102 realizations (grey dots). The blue dots mark the PDF averaged over said ensemble, while the red curve is the corresponding the Holtsmark distribution (15) computed for the local value of the density, ρ(r), and average number of particles in the shell, ![]() .
.
Current usage metrics show cumulative count of Article Views (full-text article views including HTML views, PDF and ePub downloads, according to the available data) and Abstracts Views on Vision4Press platform.
Data correspond to usage on the plateform after 2015. The current usage metrics is available 48-96 hours after online publication and is updated daily on week days.
Initial download of the metrics may take a while.