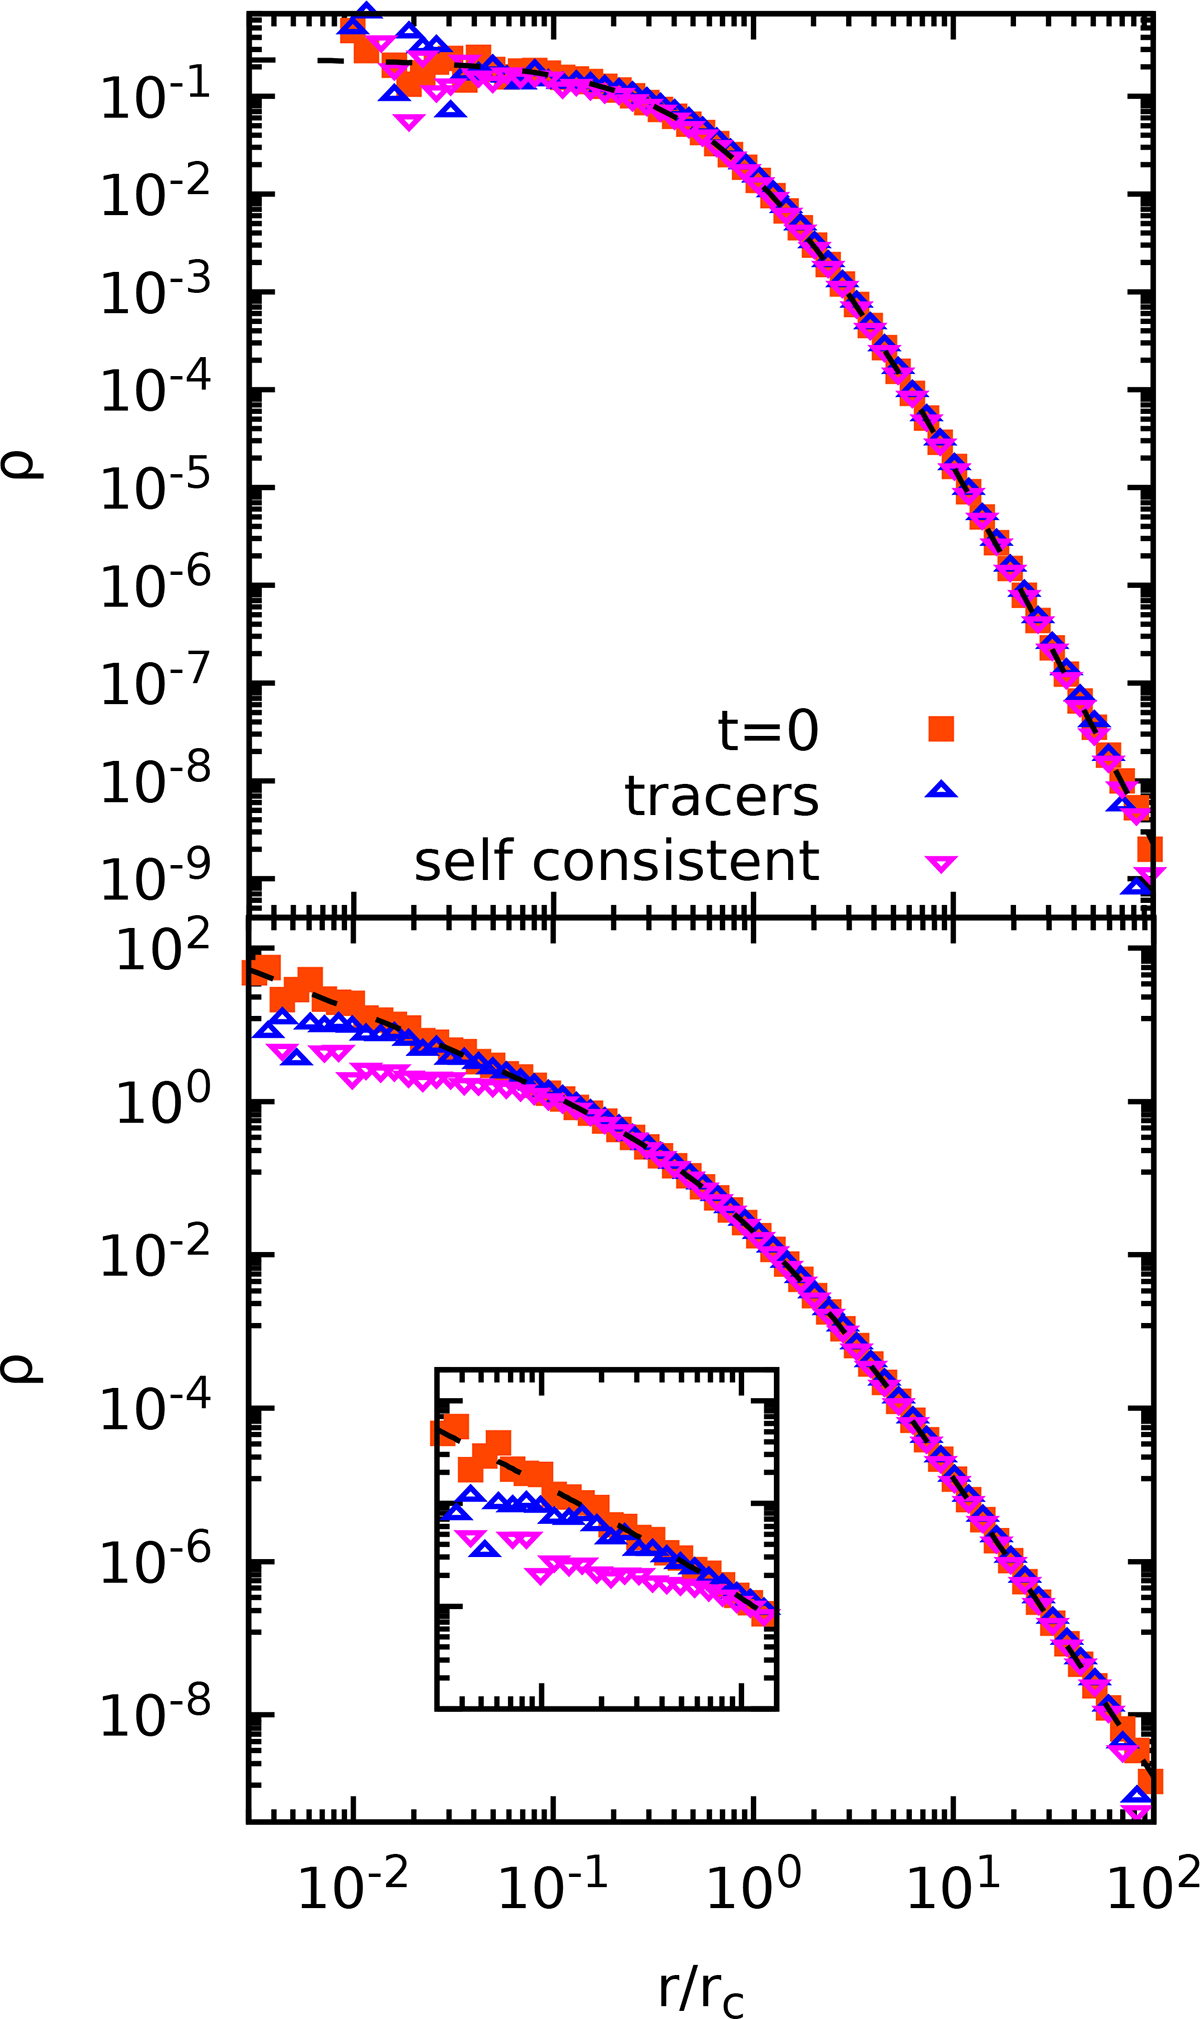
Fig. 4.
Download original image
Initial density profile corresponding to a γ = 0 (top) and a γ = 1 (bottom) model (filled orange squares) and corresponding density profiles at t = 103tc in the self-consistent and tracers in smooth potential simulations (upward blue triangles and downward magenta triangles, respectively). The dashed black lines mark ρ(r) as given in Eq. (5). The points correspond to the same simulations of Fig. 3.
Current usage metrics show cumulative count of Article Views (full-text article views including HTML views, PDF and ePub downloads, according to the available data) and Abstracts Views on Vision4Press platform.
Data correspond to usage on the plateform after 2015. The current usage metrics is available 48-96 hours after online publication and is updated daily on week days.
Initial download of the metrics may take a while.