Fig. 5
Download original image
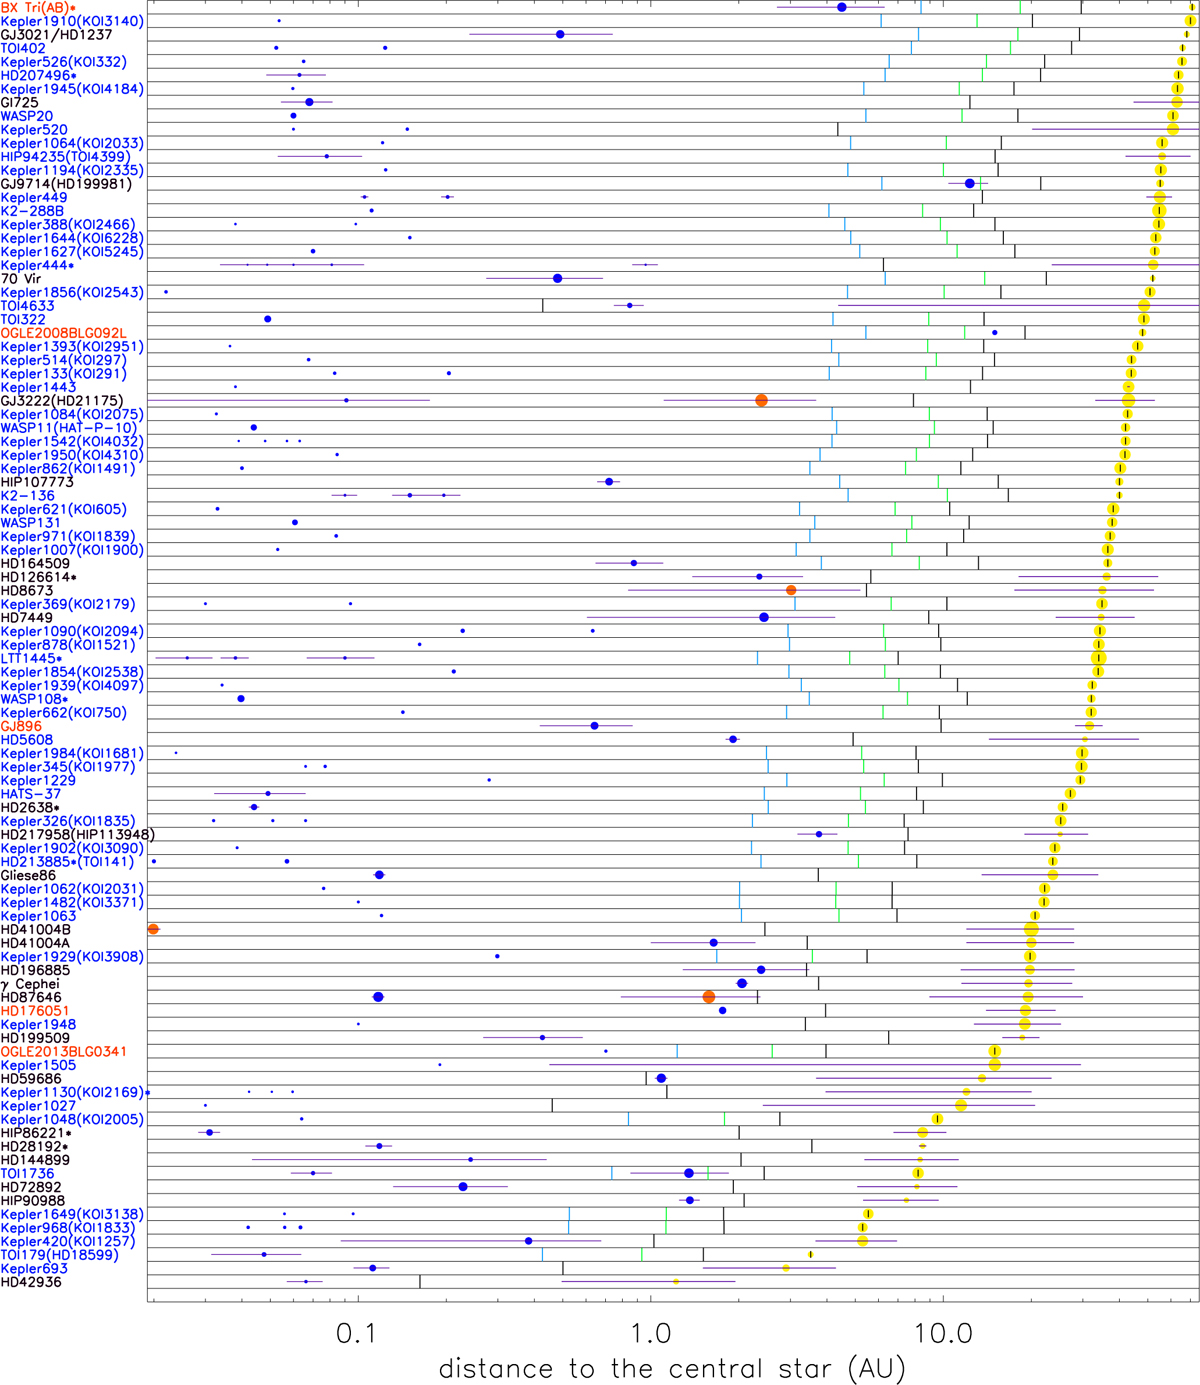
Architecture of the 100 tightest planet-hosting binaries. Blue circles show aPl, while yellow circles show ab. The radius of the blue circle is proportional to the estimated radius of the planet. The radius of the yellow circle is proportional to the cubic root of the mass ratio between the companion and the central star (for the sake of visibility, planet sizes have been inflated by a factor of 20 with respect to star sizes). For planets and stars, the horizontal purple line represents the radial excursion due to the object’s eccentricity. For systems for which the semi-major axis of the binary is unknown, we simply plot the projected separation between the stellar components. These cases are indicated with a ‘|’ symbol overlaid onto the companion star. The black vertical bars between the planet and the stellar companion show the outer limit, acrit, for long-term orbital stability as estimated with the empirical formula of Holman & Wiegert (1999). When only the projected separation (ρb) of the binary is known, then the black bar represents acrit for a system with ab = ρb and eb = 0, while an additional green bar shows acrit assuming a ‘statistical’ binary orbit (log(ab) = log(ρb) + 0.13 and eb = 0.45), and an additional blue bar represents a ‘high-eccentricity’ case with ab = ρb and eb = 0.7. Systems detected by the RV method are written in black, those detected by transit are in blue, and those detected by other methods are in red. For systems where a brown dwarf exists in addition to planet(s), the BD location is plotted in orange.
Current usage metrics show cumulative count of Article Views (full-text article views including HTML views, PDF and ePub downloads, according to the available data) and Abstracts Views on Vision4Press platform.
Data correspond to usage on the plateform after 2015. The current usage metrics is available 48-96 hours after online publication and is updated daily on week days.
Initial download of the metrics may take a while.