Fig. 3.
Download original image
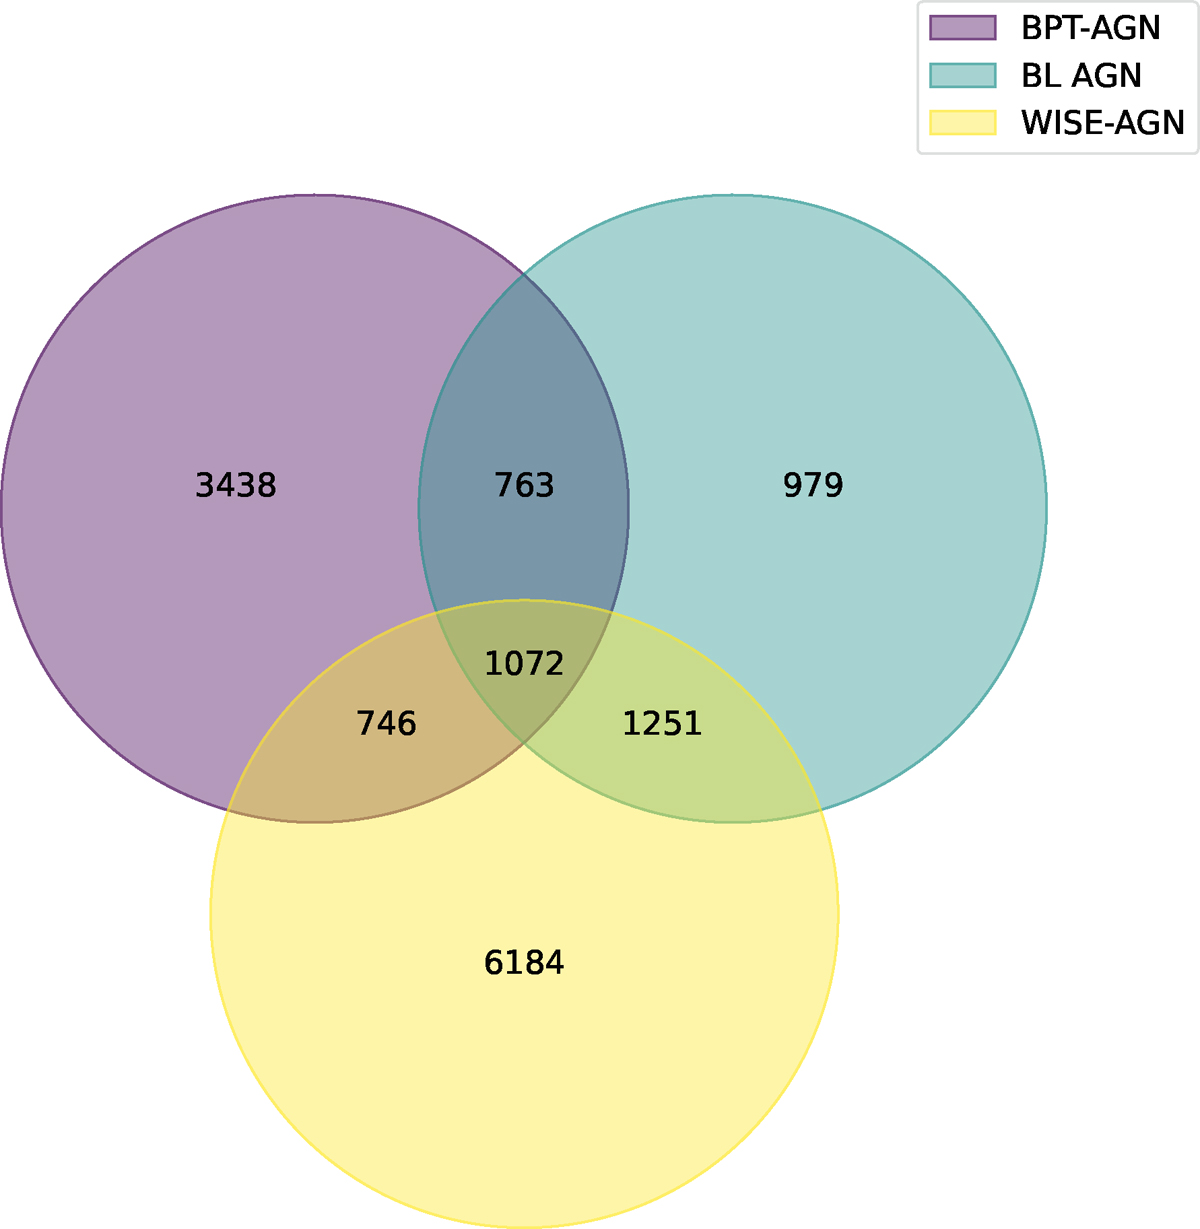
Venn diagram illustrating the overlap between the AGNs selected using different methods: BPT-AGN (violet circle), BL-AGN (green circle), and WISE-AGN (yellow circle). The areas of overlap between circles indicate the AGNs identified by multiple methods, highlighting the diversity and overlap in AGN classification across different diagnostic techniques.
Current usage metrics show cumulative count of Article Views (full-text article views including HTML views, PDF and ePub downloads, according to the available data) and Abstracts Views on Vision4Press platform.
Data correspond to usage on the plateform after 2015. The current usage metrics is available 48-96 hours after online publication and is updated daily on week days.
Initial download of the metrics may take a while.