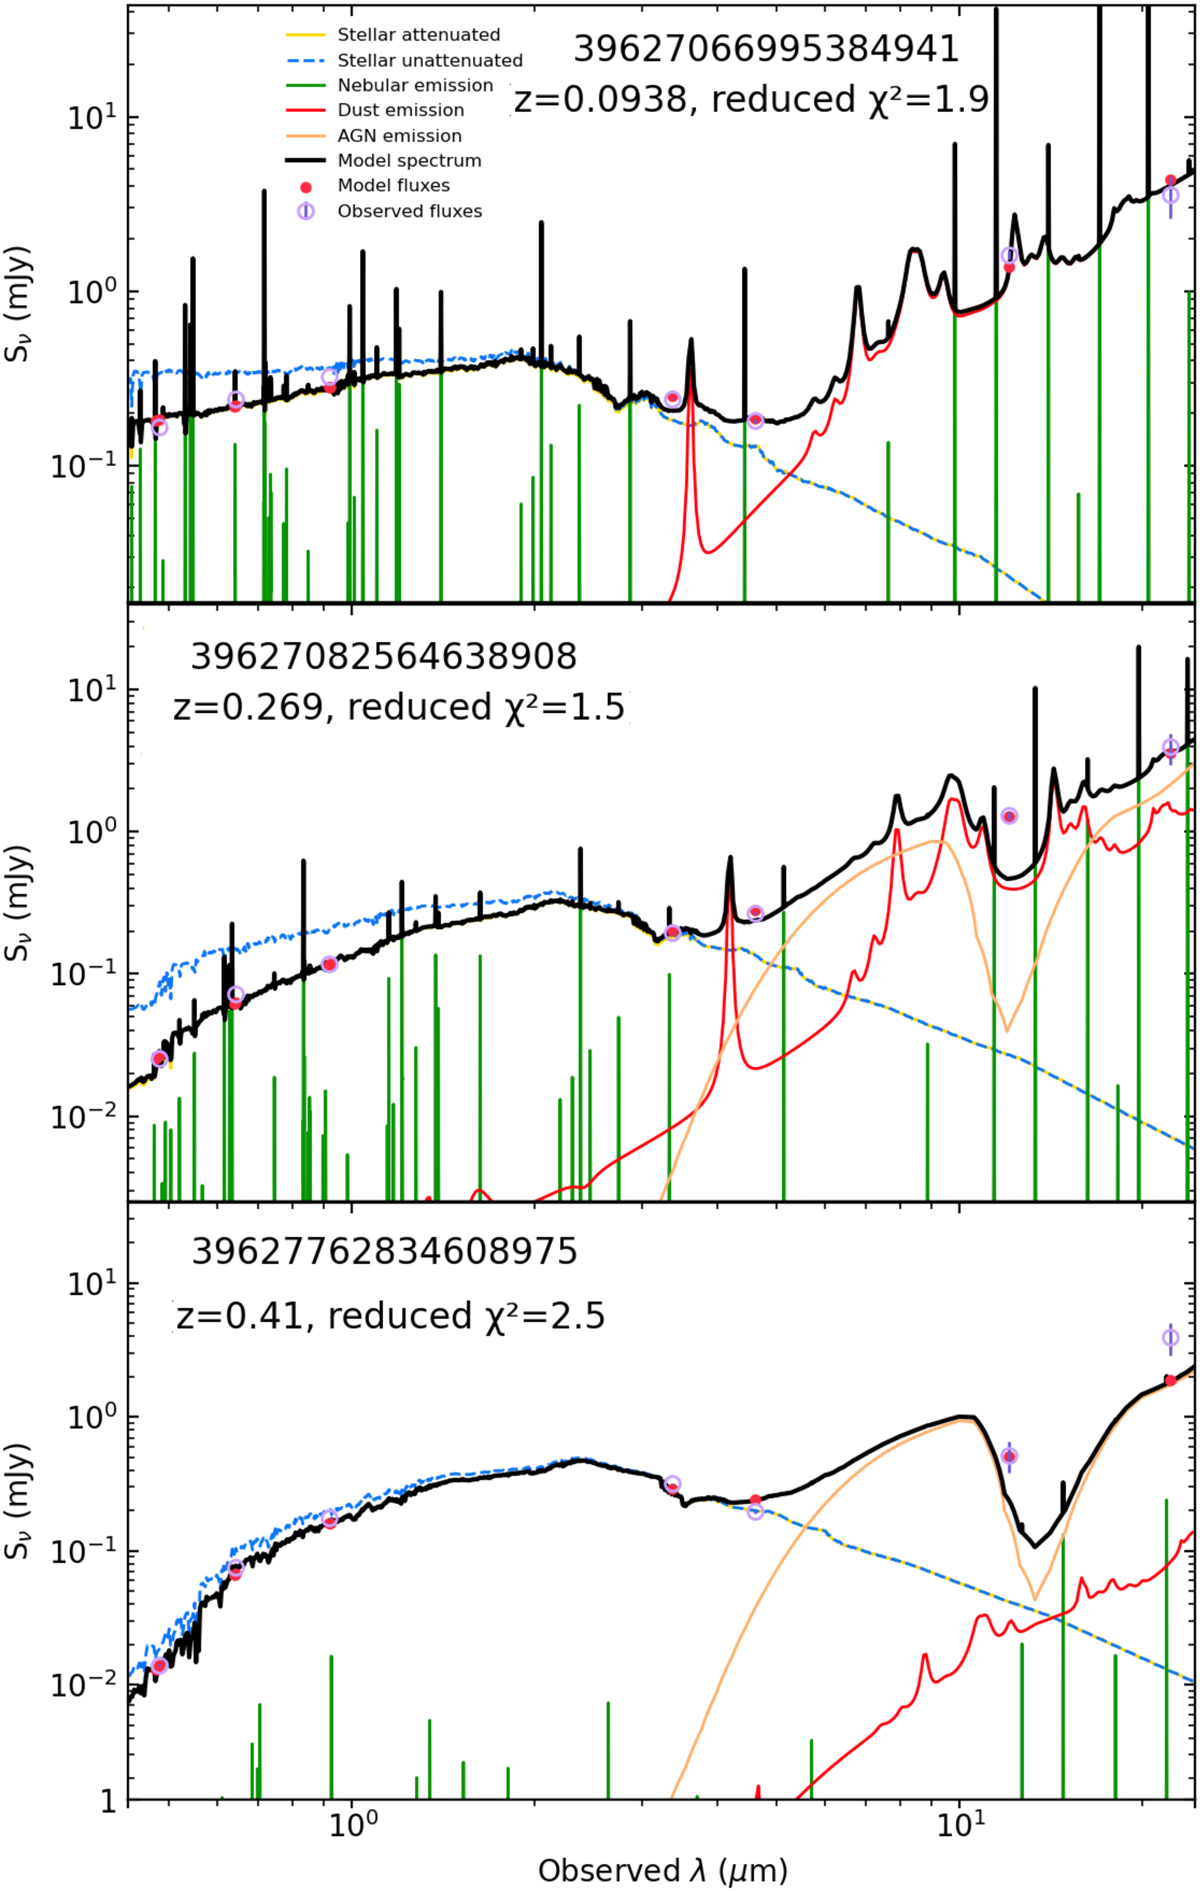
Fig. D.1.
Download original image
Exemplary SEDs of star-forming galaxies (top), WISE/BPT-AGN (middle), and SED-AGN-only (bottom). The different curves represent the contributions from various components: stellar emission (attenuated and unattenuated), nebular emission, dust emission, and AGN emission. The black curve is the total model spectrum, and the observed fluxes are overlaid as violet points. The SED of an SED-AGN-only galaxy is characterized by a dominant AGN contribution in the MIR and a relatively weak stellar component, suggesting a passive galaxy.
Current usage metrics show cumulative count of Article Views (full-text article views including HTML views, PDF and ePub downloads, according to the available data) and Abstracts Views on Vision4Press platform.
Data correspond to usage on the plateform after 2015. The current usage metrics is available 48-96 hours after online publication and is updated daily on week days.
Initial download of the metrics may take a while.