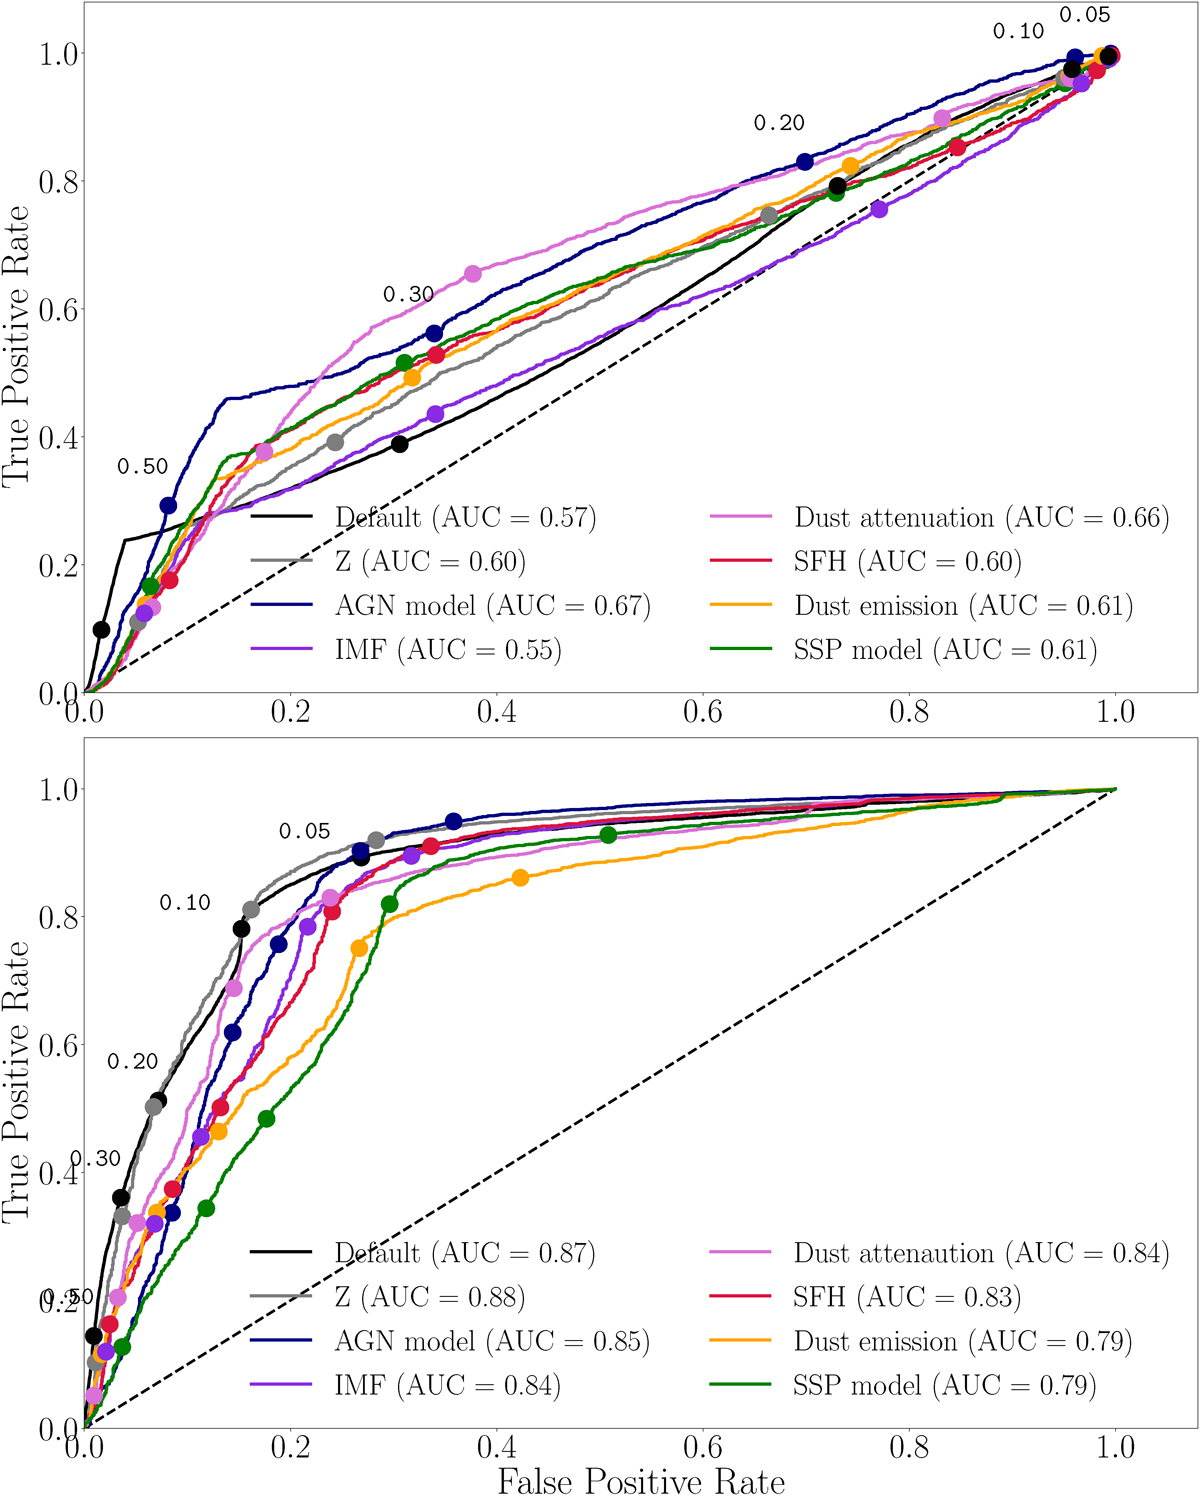
Fig. D.2.
Download original image
ROC curves for the default CIGALE configuration and different model choices (see Appendix C), showing the performance of AGNFRAC as a classifier for AGN selection. The comparison is made between sources with poor-to-moderate infrared quality (FLAGINFRARED ≤2, left) and those with high-quality WISE photometry (FLAGINFRARED = 4, right). Colored points indicate AGNFRAC thresholds.
Current usage metrics show cumulative count of Article Views (full-text article views including HTML views, PDF and ePub downloads, according to the available data) and Abstracts Views on Vision4Press platform.
Data correspond to usage on the plateform after 2015. The current usage metrics is available 48-96 hours after online publication and is updated daily on week days.
Initial download of the metrics may take a while.