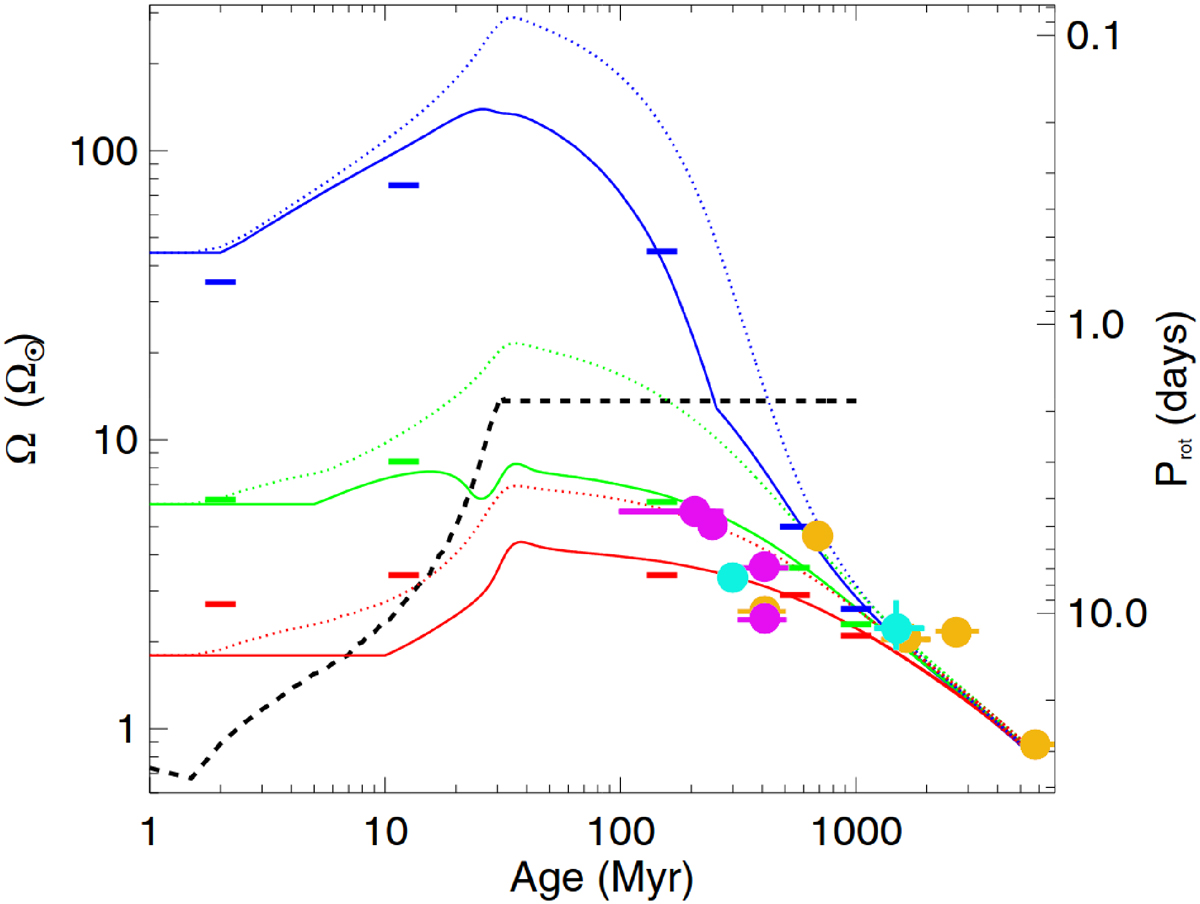
Fig. 1.
Download original image
Rotational evolutionary tracks computed by Johnstone et al. (2015a,b) and used in Tu et al. (2015), with our sample stars overplotted. Magenta data points indicate stars with a ZDI map both in the literature and presented in this work, cyan data points indicate stars with a first ZDI reconstruction in this work, and yellow data points indicate stars without a ZDI map. Some of the error bars are smaller than the data point size. The curves represent the 10th (red), 50th (green), and 90th (blue) percentiles of the stellar rotational distribution, of the envelope (solid lines) and core (dotted lines). The small horizontal lines are the observational constraints for the corresponding percentiles. The dashed black line is a time-dependent saturation relation for the stellar dipolar field, the wind mass loss rate and the X-ray luminosity. For more information, see the work of Tu et al. (2015).
Current usage metrics show cumulative count of Article Views (full-text article views including HTML views, PDF and ePub downloads, according to the available data) and Abstracts Views on Vision4Press platform.
Data correspond to usage on the plateform after 2015. The current usage metrics is available 48-96 hours after online publication and is updated daily on week days.
Initial download of the metrics may take a while.