Fig. 1.
Download original image
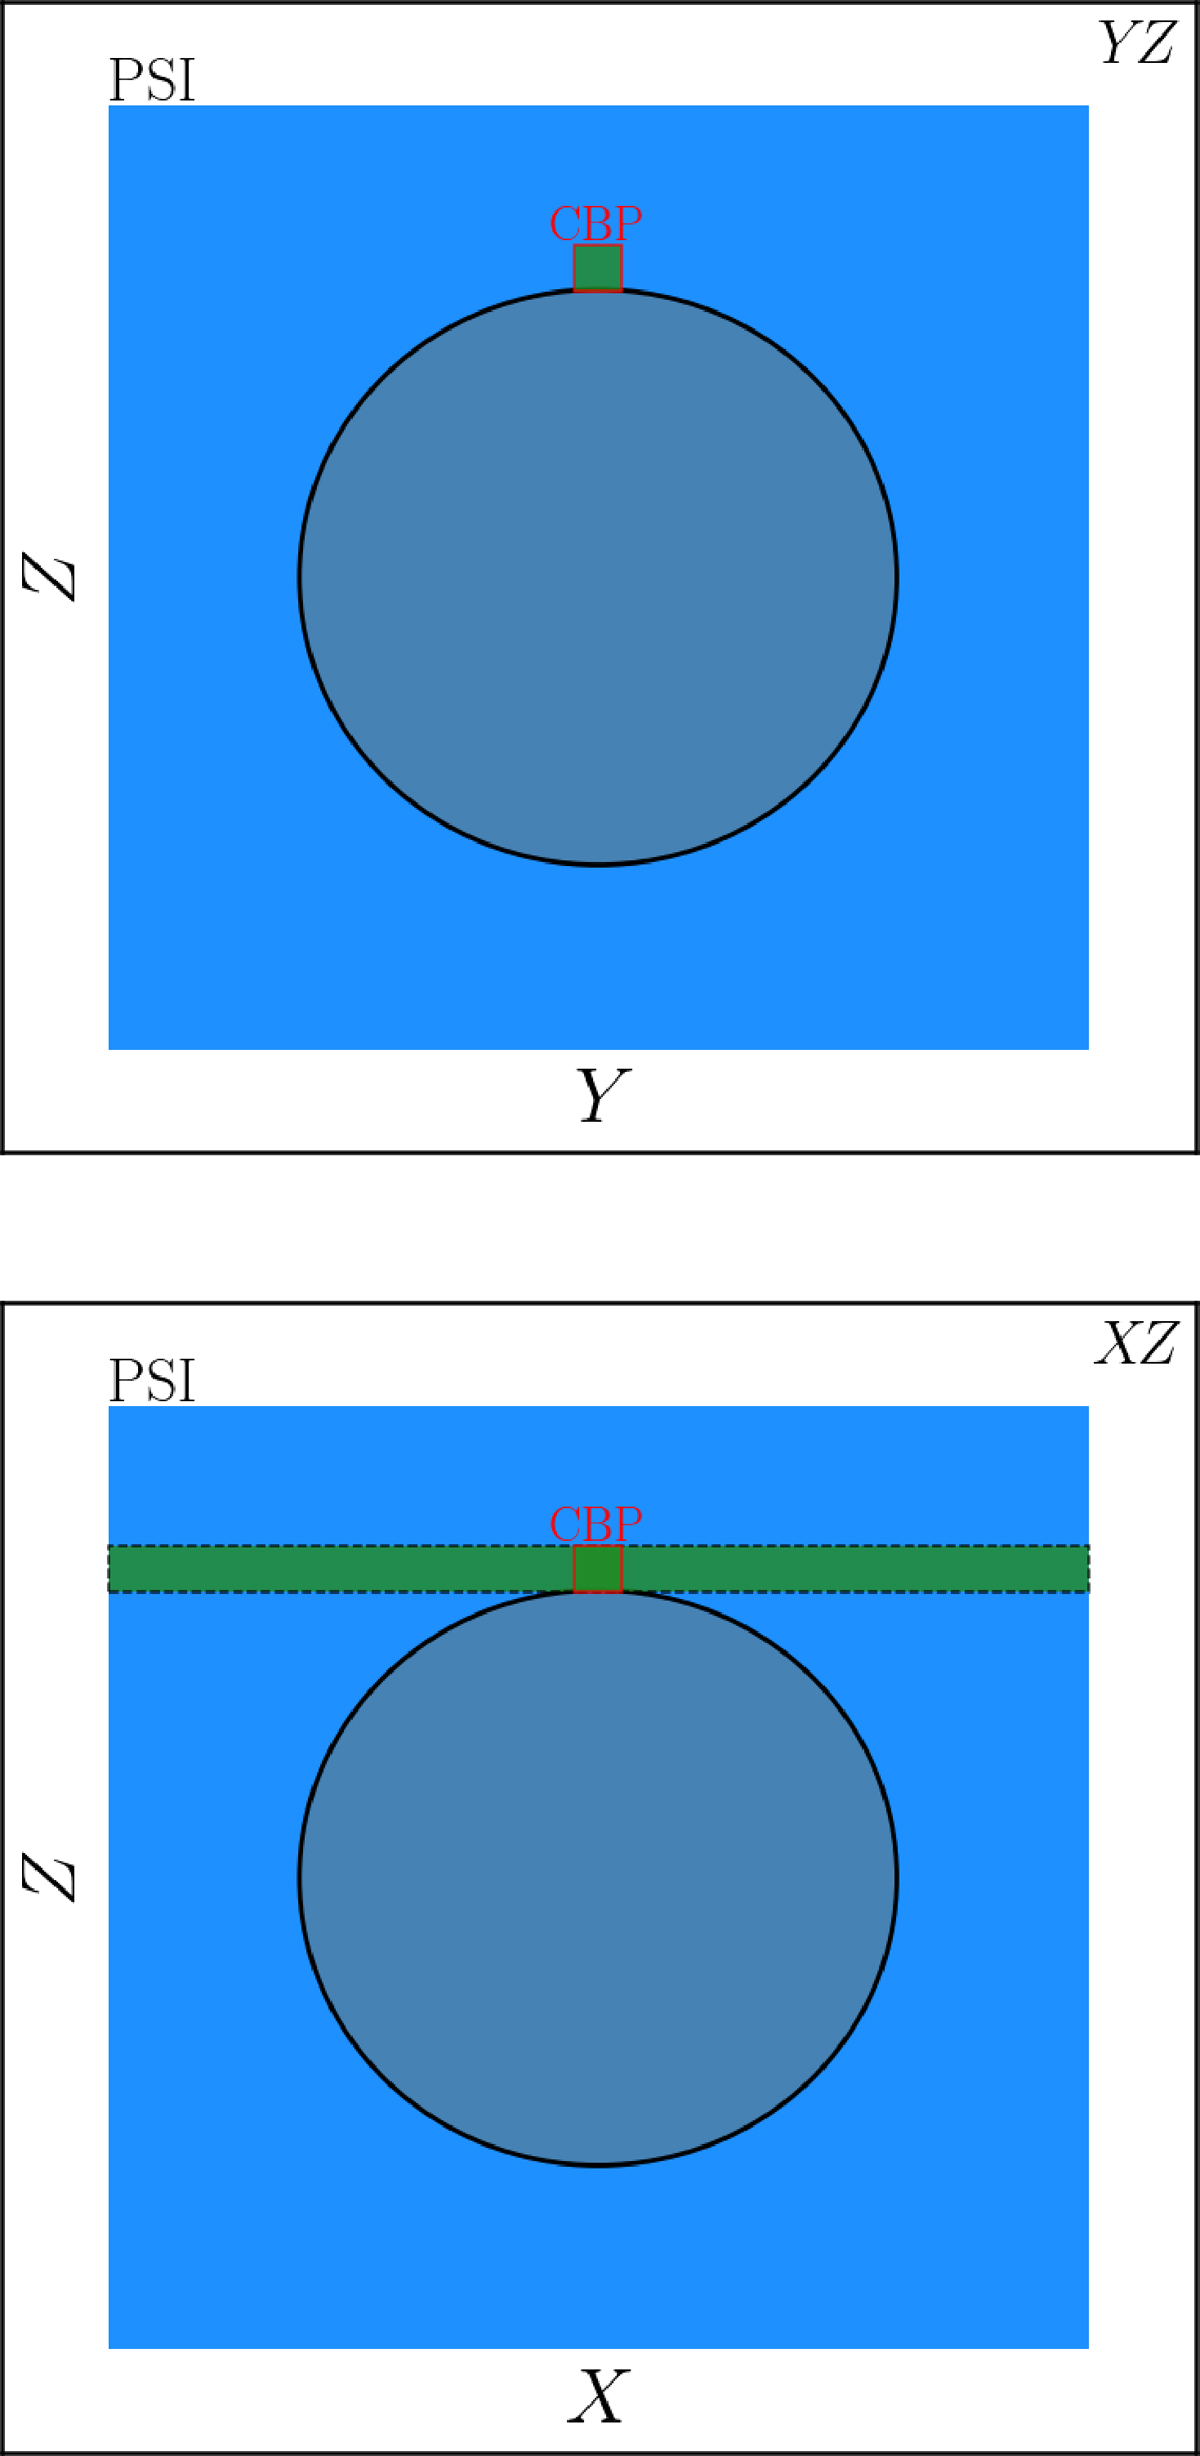
Diagram illustrating the shape of the column taken from the original PSI model, considered in this work. The blue shaded area corresponds to the original PSI model. The green shaded area corresponds to the selected column. The red square shows the boundary of the CBP model. The black circle shows the boundary between the corona and the inner solar atmosphere. Upper panel: YZ plane at X = 0, with the X-direction corresponding to the LoS. Lower panel: XZ plane for Y = 0. Figure not to scale.
Current usage metrics show cumulative count of Article Views (full-text article views including HTML views, PDF and ePub downloads, according to the available data) and Abstracts Views on Vision4Press platform.
Data correspond to usage on the plateform after 2015. The current usage metrics is available 48-96 hours after online publication and is updated daily on week days.
Initial download of the metrics may take a while.